6.48 mm diameter nozzle delivering 0.91 l/s to the runner which is rotating at 1084 rpm and generating 225 watts into the grid at an overall efficiency of 47%.

Tuesday, 3 February 2026

A new on-line monitoring system.

Home energy systems need to be monitored; they need to be monitored not least because it is satisfying to know how much energy you are producing and how it is being used, but also because monitoring can be critical in picking up small problems before they become big problems.

In operating my Powerspout, since it was commissioned I have relied on the on-line visibility of the power being produced to know when to change nozzles. As the header tank begins to empty so the power generated begins to drop, - not by much, only by about 5 Watts. But it is enough for the downward trend in the data seen on my iPad to tell me I need to change to a smaller nozzle.

With this being a key observation for me to run my scheme efficiently, imagine my consternation when, at the start of 2026, the company which had been hosting the output of my turbine, decided it was time to close down the service they had been giving. Suddenly I was in the market for a new system to replace what was no longer available.

This blog is about the new system I found. I am enthusiastic about it and want to make known the company marketing it in case others might be interested in following the same path. If you click where it is written "Live Power and Energy" on this blog page, you'll see the new 'Dashboard' provided by the company. It displays the power and energy being produced by my Powerspout in real time and is updated every 10 s.

The hardware capturing my Powerspout's output.

The system is provided by OpenEnergyMonitor.org. The company provides all kinds of monitoring, from simple systems like mine where there are only two data feeds, power and energy, to whole house systems where feeds can come from solar generation, individual house loads, room temperature sensors, EV chargers, heat pumps and more.

The company is based in Wales, UK and when you buy products from them the deal is that 20% of the value of what you've bought is credited to you against the charge for them hosting your data on the web. Each feed you sign up to costs GBP 1 per year (excluding VAT, 1.20 with VAT). The cost of the kit I purchased was GBP 345 excluding VAT, and has therefore given me credit of GBP 69. I have two feeds at a VAT inclusive cost of GBP 2.40 per year, so that gives me 29 years worth of web hosting included in the cost of buying the hardware (calc 69/2.4). 

The guys behind the company are super helpful. I received much help, willingly given, to get my system up and running. Being an 'open source' data handling enterprise, if you have the computer skills to set things up yourself, then so much the better. I don't have those skills but with their support, all went smoothly.

The 'dashboard' accessed via this blog page is the way of publishing your data for anybody to view it, but it is not the only way of accessing your data. From the account you open with OpenEnergy when you purchase from their on-line shop, you have secure access to the raw data of your system, and you can make graphs, choose time frames and make downloads. It is a very versatile platform and much better than what I had before. The picture below is an example of how detailed the view can be of the power coming from my turbine.

A detailed, more granular view of the power output in Watts from my turbine.

Here in Wales, the rain is incessant. Last month I recorded 271 mm. That makes January 2026 amongst the top 5 wettest months in the 12 years I've been keeping records.
Of course, it's good news for electricity generation. It has been the month where we have used the least energy from the grid ever, just 12.6 kWh.
And the revenue earned in Feed in Tariff (GBP 267) has contributed most of the cost of my new monitoring.
Happy days !

Tuesday, 7 October 2025

Year end results for 2024-25 water year.

 For those few people around the world who search the internet for good data on how productive domestic scale micro-hydro is, here are my figures for the past year.

As years go, it has been a dry year in terms of rainfall, and the turbine's output has consequently been not as good as some years. The year end figures were saved from being too bad by the year starting off very wet and this meant that a good deal of the year's total energy was generated by the end of February. After that, rain became scarce and generation steadily declined for the remainder of the year.

Nevertheless, with 4534 kWh generated, I can't grumble.

In each graph, the bold black line represents data from the 2024-25 water year (Oct 2024 to Sep 2025).

1. Daily output (mean power W = total daily energy kWh / 24)


2. Cumulative energy output (kWh)


3. Power duration curve (number of days generating at measured levels of power output)


4. Whole year rainfall vs whole year energy generated.


Wednesday, 16 April 2025

Penstock pipeline purging.

I hadn't been thinking that silt accumulation would have amounted to much in the penstock delivering water to my Powerspout. Yes, I did do 'flush throughs' to remove silt back in 2014 and 2018, but I haven't done one since.

But as the years have clocked by since 2018, I and others began to notice that power output for each nozzle was getting to be less in each successive year; this was most noticeable for the biggest nozzle - which used to generate over 900W in the winter months, but by 2024/5 was only producing 885 W.


There were a number of possible explanations for this fall-off in generation, - wear on the pelton runner, or changes I had made to the algorithm in the grid-tied inverter, - but when I'd excluded these, the only likely cause remaining was silt accumulation in the penstock.

So this week I set about flushing through the penstock thoroughly.


In previous 'flush-throughs' I had either removed the turbine completely from its plinth or only flushed from the top nozzle holder; this time I wanted a way of doing it which didn't disturb the turbine's seating on the plinth and which flushed the more important bottom nozzle, - which is the one in constant use. The pipe bend in the picture is 2" bore and it attaches to the 2" BSP parallel threading of the nozzle holder with a 2" union, - which has BSP taper threads.


The silt seems to have been cleared from the pipeline in the first few seconds but to be sure, we did two header-tank-fulls of flushing, with each full tank being 6 cubic metres, - it discharged in just 4m 30s.


Afterwards, it was gratifying to see that electrical generation had been improved.
Before flushing, the ac watts generated from the grid-tied inverter was 391.5 W, and afterwards it was 418.5 W; that's 27 W of improvement, representing an improvement in water-to-wire efficiency from 50.7 to 54.1%. 

Pre-flush:


Post-flush:

I'm going to make 'penstock pipeline purging' a yearly maintenance job from now on, alongside the job I already do each year of de-silting the header tank.

Thursday, 6 March 2025

After 12 years continuous operation, what does a Powerspout PLT runner look like.

 1. On the side where sunlight reaches it, despite the force of the water jetting around, there is considerable growth of algae and moss which is not present on the inner side.

Inside face:

Outside face:

2. The amount of wear on those places where the jets hit hardest is negligible. The splitter ridges of the pelton cups are as sharp as in a new runner. In my installation, the water is free of silt and free of lime and that is why the runner maintains such good condition.

Old runner:

New runner:


3. From the way the heads of the stainless steel retaining screws have been polished by water as it emerges from each pelton cup, it is evident that some of the water is directed up toward the shaft. This is important, - because it is this water which can enter alongside the shaft and reach the ‘wet side’ bearing. The V-lip seal on the shaft is placed there to prevent such water tracking along the shaft, and the twin lip seal at the inner end of the ‘Top hat’ assembly is the final barrier stopping water reaching the bearing. Both seals need to be kept in good condition.


4. My conclusion: I was pleasantly surprised by how little wear there was after 12 years of operating 365 days per year. I only replaced the runner so I could thoroughly inspect it, and having seen it's in such good condition, I will put it back for at least a further decade of use.

Tuesday, 1 October 2024

Year end results for 2023-24 water year.

The year to September 30th has seen the most generation in the eleven years my Powerspout has been running. The total energy generated was 5254 kWh.

Understanding that this figure is really quite good for a small turbine is best captured by considering what is called capacity factor.

Capacity factor is the energy generated in a year divided by the energy that could have been generated if the turbine had run everyday for 365 days at the rating specified in its technical specification.

The rating specified for my turbine is 750 watts, which means the maximum power it is meant to be able to produce is 750 W. And using this figure, the maximum energy that could be produced in a year is 6,570 kWh (calc: 0.75 x 24 x 365).

So the capacity factor for the 2023-24 water year turns out to be near enough 80% (calc: 5254 / 6570 = 0.799).

But there is a slight deception in this figure. And this is because the maximum power my Powerspout can actually produce is more than 750 W, and this is evident in the first of the plots below.

There is a reason why there is this deception: the figure of 750 W had to be specified before the turbine had even been commissioned and was a figure derived purely from theoretical calculation. This theoretical calculation had to make assumptions about a lot of things such as friction loss in the pipeline, the efficiency of the 3 phase alternator, the efficiency of the dc/ac grid-tied inverter, ...and many more factors, - all of which were little more than educated guesses.

When the turbine actually got to run, many of the guesses turned out to be on the pessimistic side and the turbine actually was found to produce nearer 800 W at full flow, and even 900 W if slightly more water than the specified maximum flow of 3 l/s was used.

So the 80% capacity factor figure is inflated, and if the true maximum power of 900 W is used to calculate it, the figure drops to 66%.  But since officially my turbine is rated at 750 W, that's the figure I'm going to continue to use for my capacity factor calculations. But I will point out that in the interests of 'honesty and transparency' you'll notice that I do say in the Scheme Details section in this blog where each year's capacity factor is given, that the figures are "taking as datum DNC 750 W" (DNC = Declared Net Capacity).

For those who like to appreciate how a small scale hydro works out in the real world, here are the figures for this past year's generation. The year 2023-24 is the black plot line, and previous years are coloured lines:


Monday, 22 April 2024

Powerspout+Solar+Battery= the perfect combination.


I've posted a video on Youtube for those who want to know the 'length and breadth' of my home's energy system.

You can find it at https://www.youtube.com/watch?v=-rmYOUQAVTk 

You'll need 20 minutes to view it all, and it comes in HD.

I'll add a link to the side bar of this blog for future access.

------------------------------------

Addendum: added 23 April 2024

In response to people wanting to know the cost of the battery storage scheme, below is a breakdown. The numbers are in pounds sterling (GBP).

The costs given include VAT at 20% (the installation was done before the UK Government decided to exempt retrofitted battery storage schemes from the 20% rate).


Sunday, 4 February 2024

Benefitting from Battery storage

There can be no better way of communicating the benefit of having battery storage than publishing the graph below.

It records the energy my house has taken from the grid each month, starting at January 2023 and ending January 2024*; the battery storage was commissioned on 1st November 2023.

The step-down in grid consumption from November is quite remarkable, - more than I ever expected.

The data for the graph is reliable; the figures come from the meter readings sent to OVO, the electricity utility who sell grid energy to me.

I look forward now to seeing how this graph pans out over a full year; the three months in which battery storage has so far been contributing, have been months when the Powerspout has generated at its maximum and there has been little input from solar; later in the year, the mix will change, - and therein lies my interest to see how the full year looks.

* I will update the graph occasionally, to give the latest information.


Addendum added 15 April 2024

How the above graph 'pans out over a full year' will depend on how total energy generation from solar and hydro changes in the course of a year.
The pattern of how it changes is seen in the graph below.
The graph shows the total kWh generated each day from hydro and solar, between October of one year and September of the next.
The blue spiky line is the kWh generated each day.
The value of the data point for each day is the 8 year average of the energy generated on that day.
The red polynomial line is the 'best fit line' for the blue line.
It will be seen that maximum generation is from mid February to June, and in this period the graph above can be expected to show the least energy taken from the grid.
Conversely, least generation happens in September / October, and in those months grid supplied energy is likely to be needed.


Wednesday, 24 January 2024

Priorities ! - part 1

Having added battery storage to my home energy system, a dilemma has been created; and that dilemma is how to prioritise the different uses for where home generated electricity can go.

To be clear what these uses are, and to place them in a descending order of rank, they are:

  1. the moment by moment electricity needs of our house 
  2. domestic hot water heating (DHW), - or more precisely, topping up the temperature thereof from the temperature reached by a log burning stove whose back-boiler also supplies central heating warmth to radiators, and never gets to be > 40° C
  3. charging the battery of our BYD home energy storage system (10.2 kWh of storage, max. input / output capacity of battery inverter is 3.7 kW)
  4. charging the battery of our old model, Nissan Leaf EV (which has the smaller 3.3 kW on-board charger)

Apart from the dilemma of ordering the prioritisation of these loads, there is the matter of devising a way of ensuring that home generated electricity goes where I want it to; and in order for it to be possible to make it go where I want it to, for that I have to have some means of 'seeing' where power is going at any given moment.

Another fundamental matter to be clear about is the philosophy I follow for how I want my home micro-grid to operate; although I am grateful for any savings I make on needing to buy-in grid energy, I am not in the business of 'doing home generation' for the sake of making money; my hydro and solar installations are both accredited for Feed in Tariff payments, and there is thus a nice revenue stream coming from those; beyond that source of income, fancy schemes such as are offered by Octopus Energy, - a company offering attractive reduced tariffs for bought-in energy at certain times of the day, and generous Smart Export Guarantee (SEG) tariffs for exported energy, - these I view as 'baits' simply to get me to sign up, and for me they hold no appeal whatsoever.

Rather, the philosophy that guides me is one of simple self-sufficiency, - the contented feeling of being able to cook, light the house, bath in hot water, and travel the limited distances we need for shopping, - and know that all the energy for these things has come from one's own 'power station', using 100% renewable energy.

At the time of writing, in January 2024, my home battery storage has been up and running for just 3 months, and those three months have been exceptionally wet; as a result the Powerspout has been producing at maximum output (900W) almost continuously and its 24 hour total output of 21.6 kWh has been more than enough energy to supply all our needs; in fact much of the time there has been so much energy that there has been some to spare which, rather than let it go out to the grid, I divert to one or both of two subsidiary loads; one of these is a DHW load and the other a space heater load, and both are in a part of the house which is presently not occupied; though unoccupied, sending power there helps to keep away the winter chill in that part of the house.

Visualising and controlling how electricity is being used around my home is crucial. 

The 'visualising' is made easy with an iPad because each bit of kit in the system can be called up in the local area network (LAN) or via SMA's Sunny Portal interface; thus the battery state of charge (SOC), the power flow at the grid connection point, the total of home generation from combined hydro and solar, whether the inverter is charging or discharging the battery, and which load the DHW diverter is feeding to, - all these are accessible from the comfort of an armchair.

Controlling is achieved with no less a degree of ease; it involves a certain amount of 'automaticity' and a certain amount of 'manual tinkering'.

Careful scrutiny of the single line diagram below indicates that the design of my system ensures that diversion to heating DHW is the first priority for where surplus home generation goes; the diversion device controlling this is a Solarcache, and by way of it, two priorities of load are controlled; when the first priority load, which is the main house DHW supply, is up to temperature and its thermostat is OFF, the second priority load is switched ON; as a result of the way I have set it up, the second priority load is comprised of the two loads previously mentioned, one being the subsidiary DHW load and the other the space heater load, both located in the chilly part of the house.


Each of these 3 Solarcache loads (one on first priority and two on second priority) is wired from the main consumer unit via its own dedicated RCBO (residual current breaker with overload), and whether a load is capable of receiving power is easily controlled by manual operation of the RCBO switch; thus 'automaticity' is achieved by the way Solarcache switches between its two priority options, and 'manual tinkering' by the RCBO switches, which determine which, if any, of Solarcache's connected loads is actually available to receive power. 

Happily the RCBO switches are very close to the armchair previously mentioned, and that makes 'visualising' and 'control' not only a convenient task, but a fun one too.

So much for the basic layout of how electricity is used around my home for meeting the first two priorities on my list, - the moment by moment power needs of the house and using any surplus primarily to heat DHW.

In Part 2, I'll explain how the BYD storage battery is kept charged, how the Nissan Leaf is charged from stored energy in the BYD battery, and why the technology of a MyEnergi Zappi doesn't seem to have a place in my set up.

Monday, 11 December 2023

Battery storage completed.

In previous blog posts on battery storage, I waded through the deliberations that burdened me as I struggled to reach a decision about proceeding with it; in this post, I just want to show what actually came of it all.

In a future post, I’ll look at the system's pros and cons, but I'll write that when more time has passed with it being operational. At present, it has only been operational for 6 weeks. In that time our energy consumption from the national grid has been less than 5 kWh (before it was 200 kWh for the same 6 week period in previous years), - so early impressions are favourable.

Location for 'battery bunker' BEFORE construction

Battery bunker AFTER completion

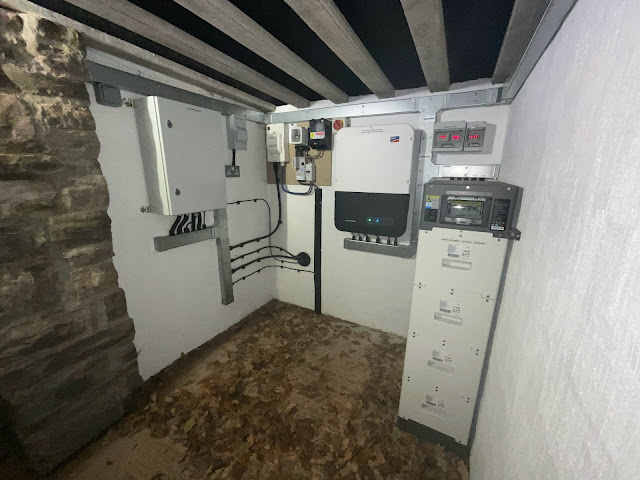
Inside the bunker

Meters for ac frequency and volts, and battery dc volts; the switch is the 'black start switch' for manual operation of battery back-up

BYD HVS battery tower, 4 battery modules totalling 10.24 kWh, with Battery management Unit on top

SMA Sunny Boy Storage 3.7-10 inverter with ac ON/OFF switch

Connection compartment at bottom of SMA inverter; additional devices on the right are a DIN rail mounted, 5 way, Ethernet switch and its 12vdc power supply

Cable entries to underneath of Enwitec Battery Back up box; the Enwitec box accomplishes all the switching arrangements for transfer from grid supply to battery supply when there is a grid outage, and back again to grid when the grid is restored; this it does either automatically or manually; manual control is by means of the "black start switch".

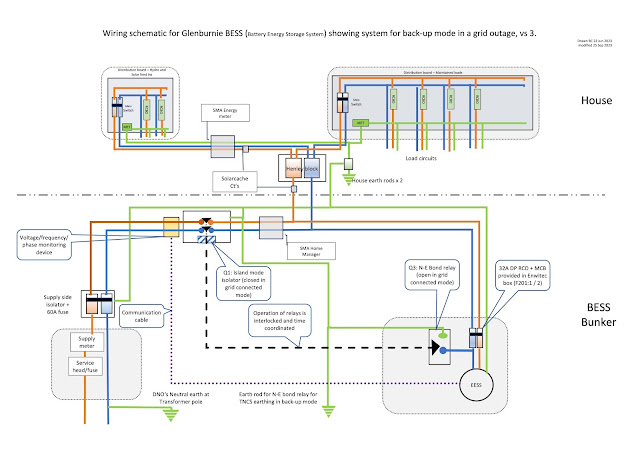
The inside of the Enwitec box; The key component monitoring power flow at the grid connection point is the SMA Home Manager 2; it is the device to which the green Cat 6 (shielded) ethernet cable is plugged into. The contactor Q1 on the left side is the device which isolates the property from the grid when battery backup is in operation. Relay Q3 is the device which ensures grounding of the neutral conductor when in battery backup mode. F1 and F2 are mccb's protecting the power supply to the Enwitec box, one for grid supply and one for battery backup supply; F201:1 and F201:2 are respectively an mcb and a rcd on the ac line connecting to the SMA SBS inverter.

The incoming National grid supply, and its meter, were moved into the bunker from their previous place in an outside receptacle on the wall of the house; this was to make more simple the cabling arrangements for battery back up; the earthing arrangement when on grid supply is TT, and on battery back-up operation it changes to TNCS. 

In the house, two new consumer units were installed, one for house loads and one for in-coming power from the two renewables available:- these are the Powerspout and 3.2 kWp of solar; the total generation from these two renewable sources is measured by an SMA Energy meter; this is the device with a red ethernet cable connected to it; the data from the Energy meter is made available by Ethernet cable connection, via a LAN network, to the SMA Home manager (in the Enwitec box housed in the bunker); also, the data from all devices in the system is made available, via a www connected router, to SMA's web interface; this they call Sunny Portal; next year 2024, for systems which have a Home Manager, SMA will be replacing the classic version of Sunny Portal, with their new web interface called Sunny Portal powered by ennexOS; when that comes, the User interface will have, so they say, a new fresher look.

The user interface provides all the expected features of instantaneous and historical energy flows that one expects from such technology; the parameters and configuration of the SMA SBS inverter can also be accessed directly via the LAN network, and this is essential in setting up the system and for investigating faults when they arise; following SMA's advice, which they strongly encourage, I went for cabled communication throughout, rather than using WiFi.

This is our meter measuring in-coming energy from the national grid; the pencilled readings top and bottom were the readings on the day when the battery storage first started operation, and that was 41 days ago; you can see that in those 41 days only 0.6 kWh of low rate energy has been used, and 3.1 kWh of normal rate; in that time we have cooked, heated our domestic hot water, charged our Nissan Leaf umpteen times, and met all the 'base load' requirements of a normal modern house; as I mentioned at the start, normally this would have taken around 200 kWh, - so the battery has, thus far, been 'transformative' !

For the really technically minded enthusiast, here are the schematics for the scheme as it was finally constructed:


Tuesday, 29 August 2023

53,760 hours.

 53,670 hours is the number of hours in just over 6 years, and this week I decided after this length of time it was time for the bearings to be changed; this blog illustrates what everything looked like when I took the bearing-housing apart having never disturbed it in all that time.

I installed the bearings on 5th July 2017 and they were SKF E2 Energy Efficient bearings; they have run continuously ever since bar one period of 48 hours in October 2018 when there was insufficient water; the only other times when the turbine shaft has not been turning is when a nozzle is changed, or the stator is changed, and such stoppages are typically for only a matter of minutes.

Of particular note is that the bearings have not been greased at all; neither was grease preloaded into the bearing housing when they were first installed; they have operated only on the grease put in by SKF at manufacture.

I made the decision to change them only because 6 years seemed a long enough interval; there were no warning signs of impending failure that prompted the change; literature from SKF suggests that the bearings can be expected to be serviceable for up to 9 years; after this length of time the grease will have come to the end of its ability to lubricate and 10% of a batch of apparently identical bearings will fail; this metric for predicting the likelihood of a bearing failing is called the T10 life expectancy; it is very much dependent on the conditions under which the bearing is operating, especially the load it is carrying, the temperature it is operating at, and most especially whether water and other contaminants can get to the rolling parts.

6 years is thus within the T10 life expectancy for the bearings - except the big unknown is the conditions under which they are actually operating.

So here is a pictorial account with captions of what the seals and bearings looked like: -

on my turbine, I have a specially made cover to help prevent water ingress; its purpose is to give a metallic face for the V-lip seal to rub on; it fits over the plastic 'Top-hat' and is held in place only by being a tight fit. 

a puller was needed to get it off.

another modification I have made on my turbine is this deflector to discourage water from entering the drainage hole of the 'Top-hat'

the first glimpse of the condition of the shaft indicated that little moisture was getting to it


for comparison, this is a picture from the previous bearing replacement in 2017, which was done after just 14,448 hours of operation and before steps were taken to prevent water ingress; it shows limescale encrusting the shaft, indicating that quite a bit of water was getting in.

detail of, and explanation of, the marks on the shaft; the brown colouring was of silt-like consistency and rubbed off very easily with wire wool; the surface of the shaft was not scored where it had been polished by the seal.

I was surprised by how much the stainless steel of the cap had been worn by the rubbing of the V-lip seal; it was almost as bad as the wear on the plastic of the Top-hat in the next picture, except that the plastic wore to be like this in a matter of months.


when I had removed the dust shields of the two bearings, the grease around the balls still looked pretty good


a close-up of the balls shows they were still well lubricated

SKF's E2 bearings have a very different looking ball cage; this is what the reverse side looks like.


the radial shaft seal on the inner end of the Top hat was a bit mucky; it has two lips and the second picture is a close up of the space between the two lips showing it to be full of the silt like material present on the shaft.

In summary, the bearings looked good enough to do another few years, but the seals were in need of being changed. The feel of the shaft rotating in the housing was of very free rotation as if the bearings were well 'run-in'. By comparison, when I had put in new bearings, of the same sort, the rotation felt rather stiff and not so free.

Unsurprising then that when I powered up the turbine with its new seals and bearings, power output was 16 watts down on what it had been, - that's a 4% loss of efficiency, - down from 44% to 40%, taking efficiency here to mean whole system efficiency, ie water-to-wire.

Ah well, - better a small drop in generation now than having the bearings fail later, - possibly in winter and having to do the job of changing them on a cold, wet day, as an urgent rather than an elective undertaking !