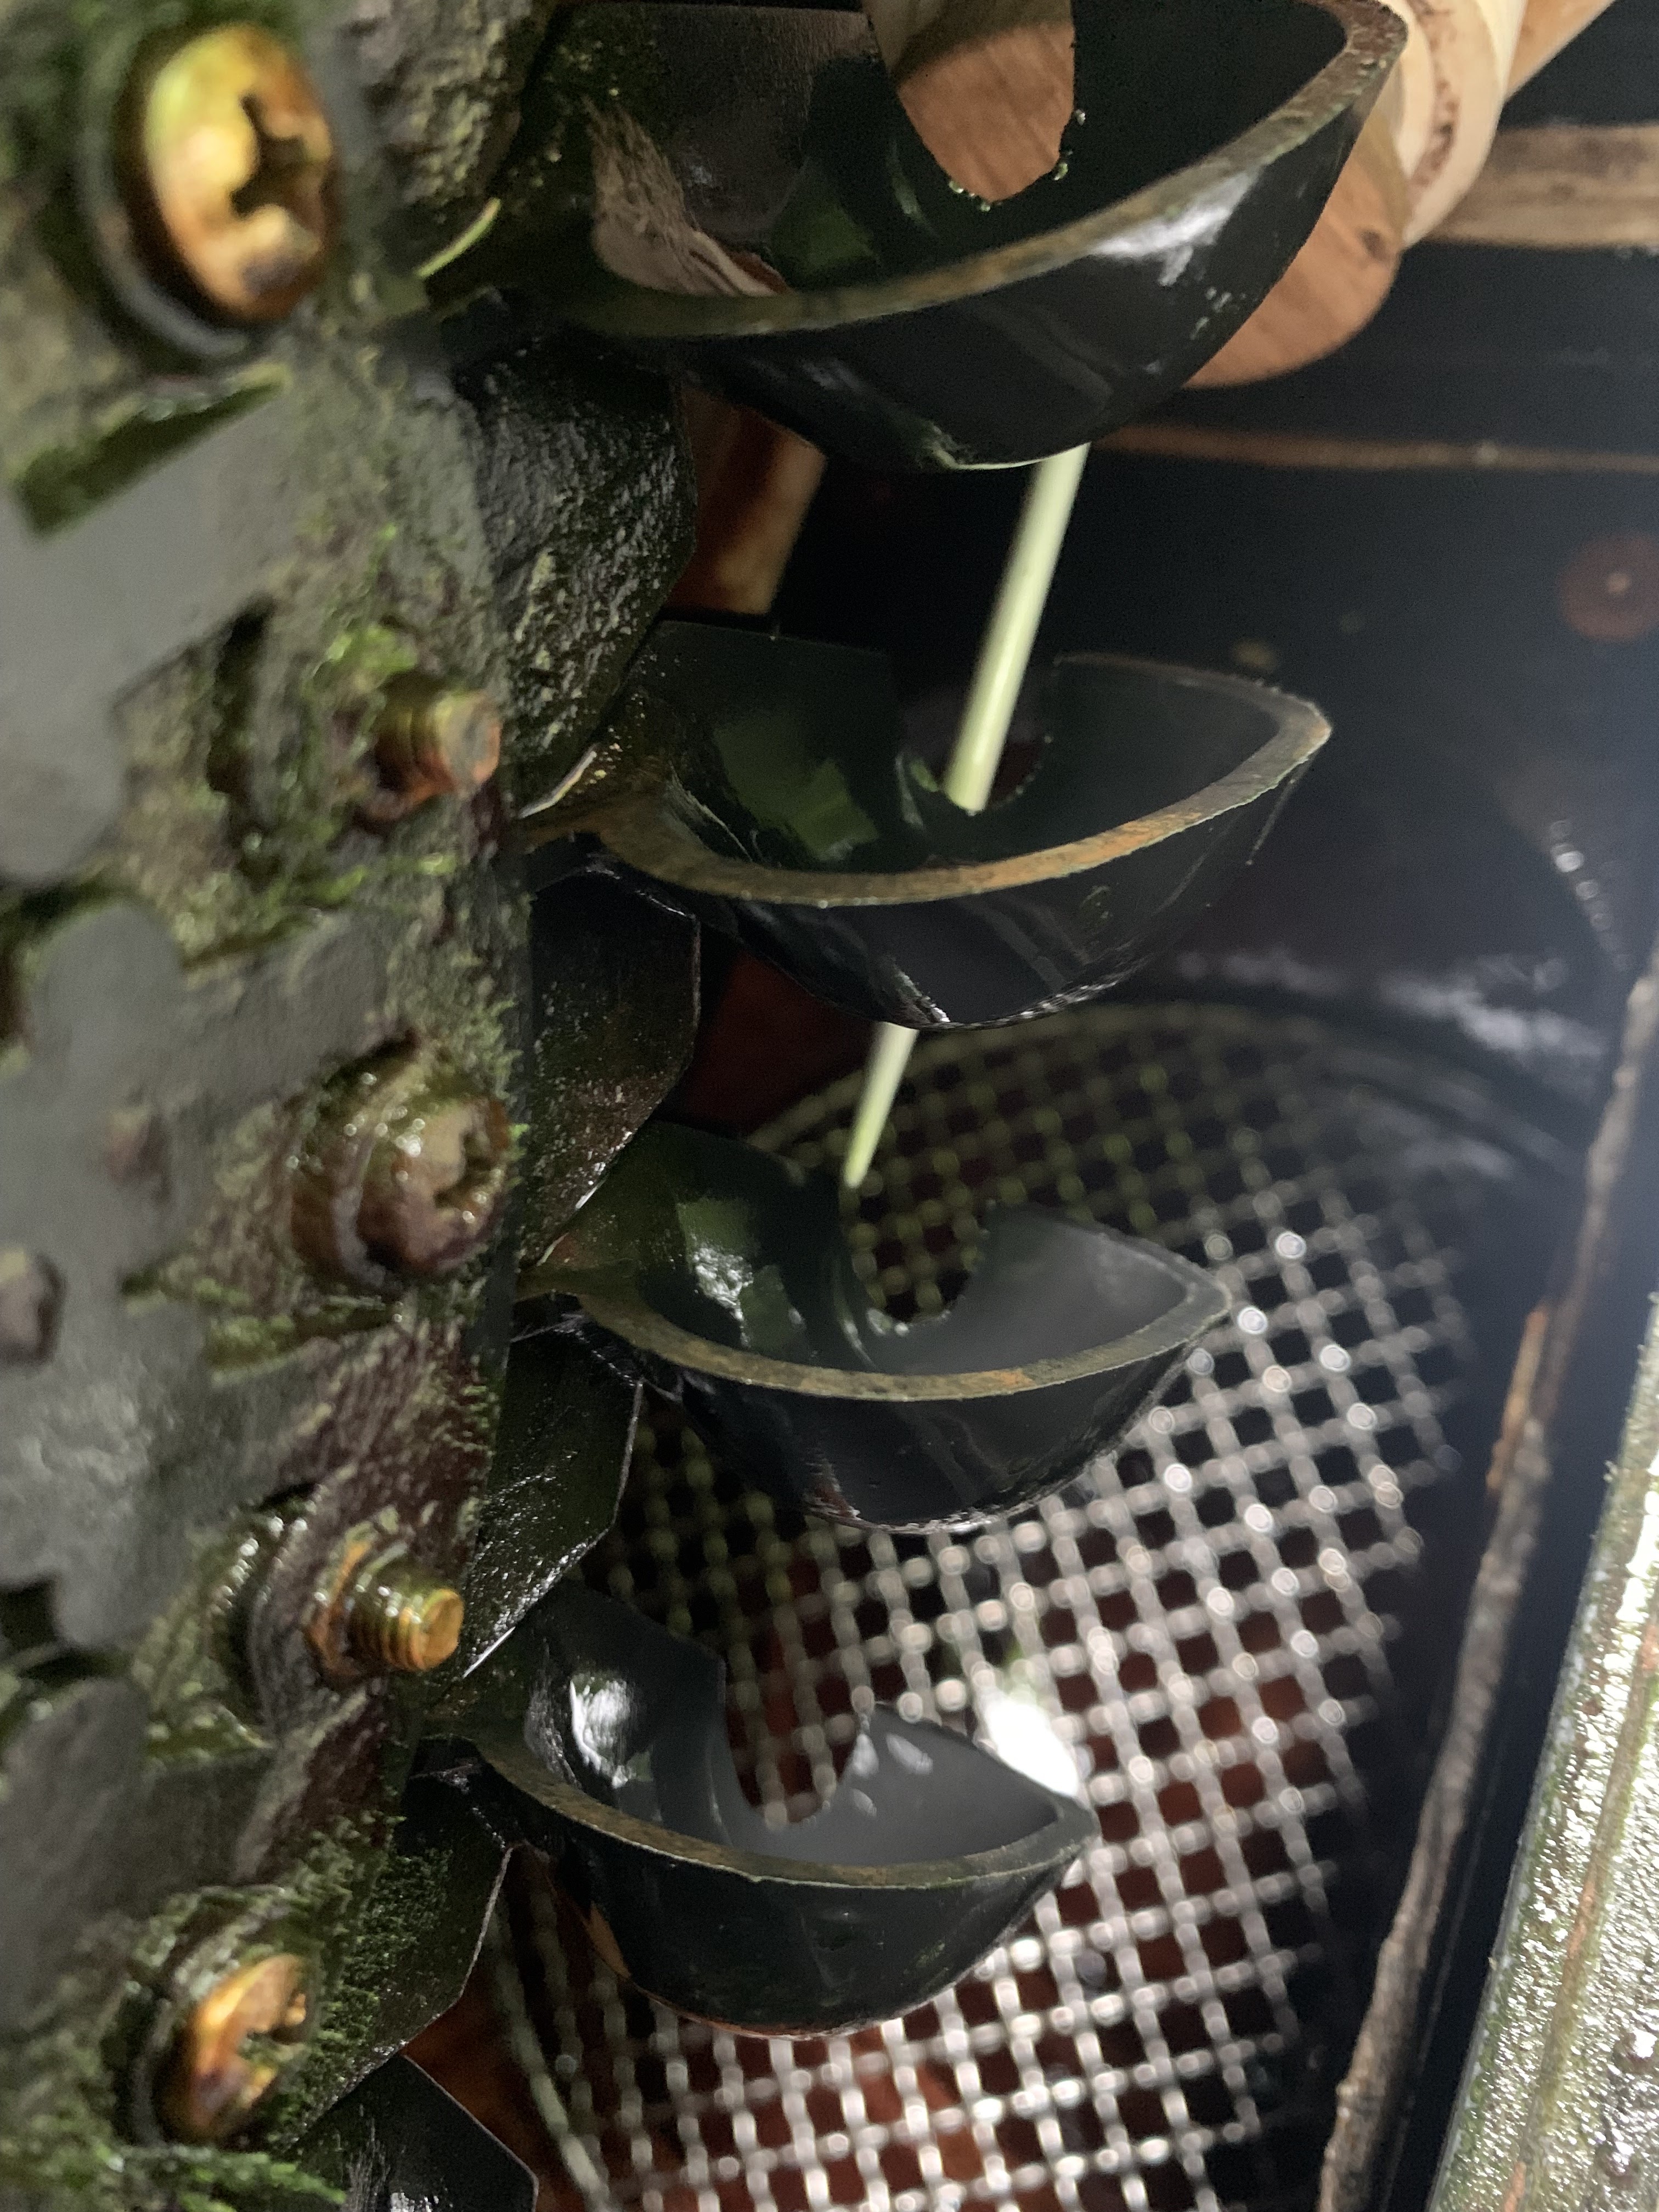
6.48 mm diameter nozzle delivering 0.91 l/s to the runner which is rotating at 1084 rpm and generating 225 watts into the grid at an overall efficiency of 47%.
Showing posts with label Nozzles. Show all posts

Monday, 19 June 2023

A lesson learned

Even after 10 years, I am still learning about my Powerspout; today the lesson has been how minutely critical the alignment of the jet to the pelton wheel needs to be for maximum power to be generated.

My lesson came about like this: the turbine had been running very sweetly on 1.23 l/s, generating 331 watts into the grid, at a water to wire efficiency of 51.2%, - when I took it upon myself to disturb this happy state of affairs by putting in a wire-mesh grill; the grill was to sit beneath the turbine and stop me dropping parts beyond reach of retrieval when I do a nozzle change.

To slip the grill into place required the plinth on which my turbine sits to be lifted a very small distance, - but to lift the plinth requires the pipe manifold to be separated from the Powerspout casing, and to do that, the jet-cum-nozzle assemblies have to be removed.

No problem I thought !

After re-assembly, I was perplexed to find that the previous output of 331 W was now only 250 W, and the overall efficiency had dropped to 41.2%.

Nor did the turbine look or sound right; the splash pattern was not what it had been and there was the sound of some water missing the pelton and hitting the opposite wall of the Powerspout casing.

What followed was much experimentation with packing washers behind the runner, measurements using my knitting needle alignment tool (see this blog) and checking and rechecking what else could have been inadvertently put out of alignment.

Eventually, it was a hammer and a piece of wood that solved the issue, - by judicious tapping of the jet-cum-nozzle assembly whilst the turbine was running.

The tapping restored the original happy state of affairs by moving the assembly tiny amounts within the bounds of the hole in the casing through which the assembly passes, with these barely perceptible movements being judged good or bad only from observation of the splash pattern and from the sound the turbine was making.

Creating a Powerspout installation is a labour of love; having created it, everyone wants 'their baby' to generate as much as their site conditions allow; as this lesson teaches, it's worth checking that your jet alignment really is optimal.

Here are some pics to put flesh on the day's adventure:

Wire mesh grill in place beneath where pelton runner normally is attached to the shaft.

Using knitting needle tool to optimise alignment of runner to centre of jet.


 "if all else fails, 'it it wi' 'ammer" !

Monday, 12 July 2021

My chart for optimum Powerspout operation.

Powerspout owner / operators who rely on a water source that is seasonal will be familiar with the challenge of needing to optimise the output of the turbine when using different sized nozzles for the different seasons.

In this blog, I'm posting the chart I use to help me with this challenge.


For me, the variables are the type of rotor, the amount of rotor packing, and the type of stator. 

When flows are good and a big nozzle is in use, so much torque is produced by the jet hitting the pelton that the more highly magnetised Type 2 + rotor is needed to keep turbine speed down to a speed where maximum power is produced.

At the other extreme, when flows are least and there is a small nozzle, the torque lost in overcoming the attraction between the rotating magnets and the iron cores of the stator is such a large proportion of the total torque being produced by the pelton that the number of poles in the stator has to be reduced from 42 to 18 in order to keep shaft speed up.

Between these two extremes, the chart gives me a system, which I've built up from experience over 8 years, to guide as to when to change from one type of rotor or stator to the other, and as to how much packing to place beneath the rotor for each of the 13 nozzles I employ.

The chart also has a column for efficiency, and this is 'whole system' or 'water-to-wire' efficiency. Numerous factors contribute to this figure, and these include: how good the penstock is; how good is the alignment of the jet on the splitter ridges of the pelton cups; how well cut are the nozzles to give a good jet profile; how much drag effect there is from grease in the bearing housing; how much transmission loss there is between turbine and inverter, (this will vary with the current); how good the efficiency of the inverter is at different input voltages; and how inefficient the Smart Drive alternator becomes by packing off the rotor. 

Peak efficiency can be seen to be 56.8% and this is achieved with nozzle XII, delivering 2.43 l/s at 1102 rpm, generating 723 watts leaving the inverter.

As I write this, the nozzle in use is number VII and the Powerspout is producing 321 watts; for this time of year this is exceptionally good and is a reflection of the rather wet summer we are having so far; unlike most people, I'd quite like it to continue that way !

Thursday, 23 April 2020

Changing a nozzle - in 28 seconds !


Covid 19 lockdown is making me experiment with new ways (for me) of using digital media.
Here, filmed in time lapse, is the bottom nozzle being changed for a smaller one because water supply is drying up.
The smaller nozzle also required two spacer washers to be added under the Smart Drive rotor - but filming of that didn't work out; maybe I'll try again and add it later .
Enjoy !

...next day:
it turned out that two washers generated fewer watts than one washer so today I removed one; here is the video in real time:


you'll see that: 

  • the rpm before removing the washer, when the turbine was connected to the grid, was 1152
  • the rpm after removal was 1218, but this was before the inverter had established connection to the grid
  • when the inverter established grid connection, rpm came down to 1058


The effect of this exercise is seen in the record below of output to grid: power output rose from 443 W to 468 W.
And this means that overall efficiency is better at 1058 rpm and one washer (53.6%) than at 1152 rpm and two washers (50.9%).
 A nice demo of how fine tuning can gain a few watts.


Sunday, 15 September 2019

Cutting an in-between nozzle

In Wales, September and October is when water supply is at its lowest.  It's the time when the water available to my Powerspout is diminishing steadily. 

Such is the series of nozzles I use that as water supply decreases, a step change happens in the amount of water delivered to the turbine every time I put in a nozzle with a smaller orifice.  

But the rate at which the autumn decrease in flow occurs is steady and leisurely, and sometimes the change between two nozzles in my series is too great, - the system gets to miss out on some of the flow of water even though it is there for the taking. It is for this reason I have found myself needing to cut a nozzle which is an 'in-between' size, in-between the size of two existing nozzles. 

The challenge facing me was twofold: first to decide what orifice diameter would deliver the in-between size I was aiming for, and second how to cut that size precisely.

To resolve the first, I needed to understand the relationship between orifice size and flow. Clearly, head pressure determines how much water passes through an orifice, but when considering a single installation, head pressure will remain the same for all sizes of orifice and so doesn't enter into the relationship.**

This leaves orifice size and flow being the only two variables, and knowing these for all the nozzles I use, I plotted one against the other to get the graph below. The mathematical formula defining the relationship of flow (y axis) to orifice diameter (x axis) is conveniently given by the Excel graphing program:


The two red arrows mark the positions of the two nozzles between which there was too big a step, - I needed to cut a nozzle which was as near as possible midway between them, and that would be a nozzle having an orifice of 5.7 mm, giving a flow of 0.73 litres / sec. 

So far so good !

But cutting the nozzle to the required size was not easy.  I do this job on a wood lathe (see here) and if you take off too much the orifice is too big. For this reason my first effort failed and the second almost ended the same way.  In the end, I had to be content with a diameter of 5.8 mm which, according to the graph, will deliver 0.75 l/s. It's the point on the graph marked with a blue arrow.

You might think that such precision in trying to cut a nozzle to an accuracy of 1/10 of a millimetre is over the top, - and you're probably right ! But this 'in between' nozzle will probably be the right one to use for the next 2-3 weeks until the steadily diminishing flow eventually makes it too big to use.  My reckoning is that the extra kWh's of generation it will make possible in that 2-3 weeks, as compared with the smaller nozzle I would have had to use, will make the exercise worthwhile.

Time will tell.

Noted added later: to my surprise, the rains came early; instead of flow diminishing, it started picking up; so the in-between nozzle only found itself in use for 10 days.

**  Head pressure can drop with higher flows if the penstock has too small a bore but having a generously sized penstock and with the meagre flows my turbine takes, head pressure can be taken as constant.
Note that the plot will only be true for sites having the same head as mine, i.e. 53 m, and will not be correct for a site with a different head.

Saturday, 13 April 2019

Measuring nozzle Cd

EcoInnovation, the company in New Zealand making Powerspout turbines, has developed a new jet nozzle.  It's longer and more tapered than the original and the change in design slightly changes the way the nozzle performs.  There is a theoretical flow an ideal nozzle will deliver which is dependant on the orifice size and the pressure head.  However in the real world the actual flow is less than the ideal by what is called the Discharge Coefficient (CD), and it was the CD  for the new nozzle which needed to be measured.  This is how it was done.

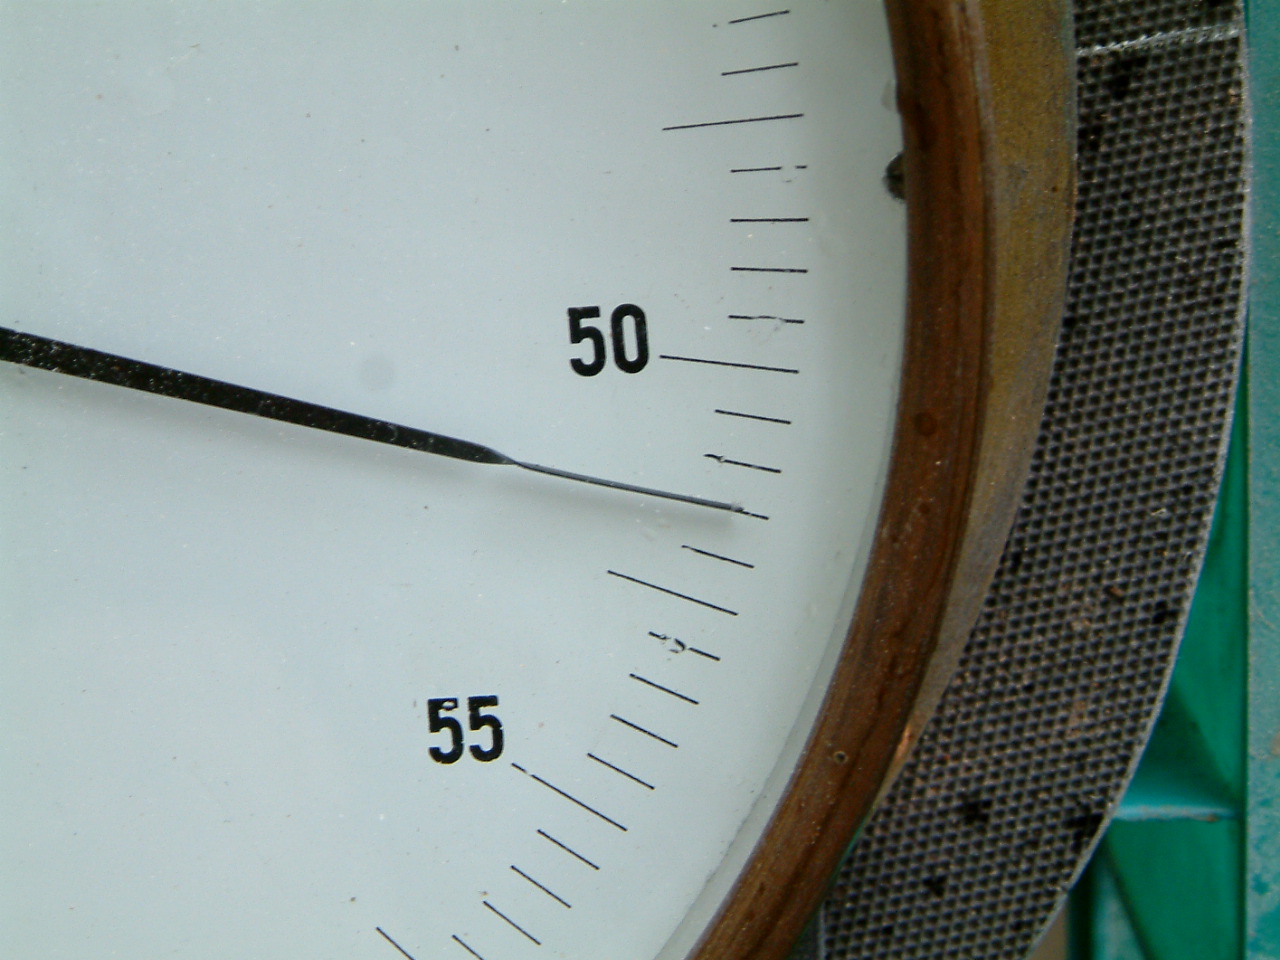
1. The formula* for determining CD requires net head to be known, - net head being the water pressure at the entry to the nozzle when it is operating.  The very large pressure gauge in the picture, calibrated in metres head of water, provided the means for measuring it.  Plumbing it to the manifold required the temporary removal of the upper pelton jet.


2. The formula also requires the flow through the nozzle to be known. This was determined by measuring with a stop watch the time it took for a defined volume of water to pass through the orifice.  This defined volume was 429.5 litres. It was known to be this because a drop in water level in the header tank of 104 mm could be calculated to be equal to this volume.  The height drop of 104 mm was determined by two knitting needles set exactly with their points that distance apart. The stop watch was started when the surface tension 'grab' to the upper needle was broken and was stopped when broken again at the bottom needle. The inflow of water to the header tank was diverted while each measurement was made.  The measurement time varied between 131s for the nozzle with the largest orifice and 20m 11s for the smallest.


3. For 13 nozzles with different sized orifices, paired sets of net head and flow measurements were obtained. The Discharge Coefficient for each nozzle was then calculated and the results, with the flow for each nozzle, plotted in MS Excel:


4. As can be seen, the Discharge Coefficient is not the same for all sizes of nozzle.  For the smallest size, nozzle I, where the flow is least, the CD is close to unity** indicating that actual flow is the same as would be expected from an ideal nozzle.  But as orifice size increases, the CD falls.  

5. The new type of nozzle performs better than the old.  Old nozzles had a mean CD of 0.85 whereas the new 0.90.  

6.The value of Discharge Coefficient for a nozzle depends on the pressure difference between the pressure of water entering the nozzle and the pressure once it has left through the orifice.  So although on my site (which has a pressure head of between 51.5 and 53.6 m depending on flow) the CD has been measured as indicated above, the same nozzle on another site with a different pressure head will have a different CD, though it won't be greatly different .

* Q = CD x Anoz x Sqrt (2g x Hnet) whence CD = Q / (Anoz x Sqrt (2g x Hnet))

** The result obtained was 1.01, i.e. better than unity, which is not possible and represents experimental error.

Friday, 20 January 2017

After waiting...

After waiting a month for rain, I've given up waiting any longer, - yesterday I got on with measuring values for the discharge co-efficient of my nozzles.  This was the job left hanging at the end of the last diary entry and is part of my aim to refine the accuracy of knowing what flow the jets deliver.

At this time of year I had hoped that rain would have been increasing the flow and that I could have done the measurements at each increase in nozzle size with little inconvenience; there being no rain, no increase in flow and no call to increase nozzles, all I could do was measure the smaller nozzles one after the other in a single blitz of measurement.

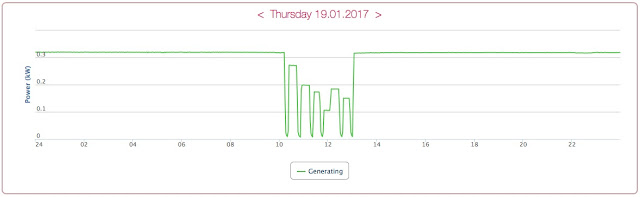
It made for a lot of exercise up and down the hill between turbine and header tank, - and for an interesting record in the on-line power trace:


The results of the experiment are presented in the following graph; on it I have also indicated the flow each nozzle delivered, as determined by measurement:


I was only able to measure the seven smallest nozzles, identified by Roman numerals I to VII; apart from one outlier in the measurement of nozzle IV (which I am at a loss to explain**), the others came in with discharge coefficients scattered around the 0.85 value; there was no obvious trend for Cd to increase or decrease with change in orifice size; I conclude from this that Cd is determined only by the design of the nozzle, - design that includes such features as its angle of taper, its length and the smoothness of the inner surface over which water is flowing. Whether Cd changes with head was something I couldn't determine with this experiment conducted as it was at one site.

Thus far so good: - from now on I will take 0.85 to be the discharge coefficient.  In time there will be opportunity to take measurements for the larger nozzles VIII to XII and when available these will add weight to the picture so far obtained.

Does all this cause the earth to shift on its axis of rotation ? - no but it's still worth investigating !

**later I discovered this nozzle was badly cut explaining why it was different.

Addendum dated 2 Feb 2017
Today copious rain has made it possible to measure the Cd and flow of the remaining 5 nozzles; the results are shown in the revised chart below; overall the Cd of EcoInnovation nozzles on my site seems to be 0.85 ± 0.01.


Tuesday, 20 December 2016

Knowing the flow.

Putting a numerical value on the flow being delivered to your turbine isn't important to most Powerspout owners; it's sufficient to open a valve, one or two of them for a pelton, or up to four for a turgo, and let the turbine spin; the business of knowing what flow is actually being delivered in litres per second, or gallons per minute, doesn't really matter; all that matters is that the flow delivered is not greater than what is available.

In the last diary entry I suggested I know what flow each of my nozzles delivers; that the figure for each can be calculated from a formula; that the accuracy of the result given by that formula depends rather too much on the value assigned to two inputs: the nozzle discharge coefficient (Cd) and the net Head (Hn).

Today, I've been doing an experiment to check the accuracy of the figure for Cd that I've been using in the formula over the past three years, - and I've found it's way out; the true flow from each nozzle is significantly less than I've been supposing; for me, and perhaps for some other operators of Powerspouts, this has important implications as I'll go on to show, - but first the experiment:

It involved measuring flow rate by stopping the inflow to the header tank and measuring the time it took for the level to drop a measured amount; with knowledge of the dimensions of the tank, the depth dropped and the time it took, calculating the flow rate was easy. Small errors enter because the flow will change as the water level drops (but change only to a tiny extent), and because the internal dimensions of the tank are complicated by internal flanges (a 'best-guess' correction was incorporated).


To get a precise measurement of the drop in water level, two 3 mm knitting needles were mounted in a bit of wood, rigidly fixed to the tank; the tips of the needles were at different levels, a difference which could be measured to 0.02 mm with a vernier caliper; timing started when the falling water level broke the 'grab' on the tip of the higher needle, - the 'grab' being the attachment to the tip of the needle caused by surface tension, - and ended when it was broken on the lower placed needle:


Three runs were made and all provided near identical results: for the nozzle I was using it took 5 mins and 46.7 secs for the water level to drop from one needle tip to the other; calculation gave the flow rate as 1.25 litres per second whereas before I had thought it was 1.29 l/s.

Now you might think this difference to be small but its effects are big; using the figure for flow rate measured today and using it in the formula to do a 'back calculation' of Cd, instead of Cd being 0.91 as I had previously been assuming, it comes out at under 0.88.

Re-calculating the flow for each of my nozzles using a Cd of 0.88 makes each have a flow less than I had been reckoning on; what does this mean in the real world? - it means two things:

  • when I thought I was delivering the maximum flow my abstraction licence allows (3 l/s), in fact I was delivering less than this; for the future, delivering a true 3 l/s will mean more power when operating at the top limit of flow.
  • 'whole system efficiency' improves with this new information and this makes to be less the factor used in the annual calculation of the total volume of water abstracted, the so-called Hydro Abstraction Factor (HAF), - used to calculate, from the kWh's produced, the volume of water abstracted;  my HAF drops from 13 m³ / kWh to 12 m³ and the effect of this is to reduce the likelihood of my going over the volume I'm allowed to abstract in a 12 month period.
As carried out today, the test to verify Cd was performed using just one nozzle.  The question remains as to whether the value of Cd changes with nozzles having different orifice sizes; so I'll repeat the experiment as opportunity arises to use nozzles with bigger, or smaller, orifices.

Just at the moment though, it's so dry here that an opportunity to use bigger might be a while in coming.

Wednesday, 23 November 2016

Bringing order to nozzle changing

The heavens have opened at last !  From the middle of August until last week it has been very dry here with the water available for my Powerspout being less than 0.6 litre/sec; but a deep depression coming in from the Atlantic last week brought copious rain and has abruptly increased flow fourfold.

Although I have been looking forward to the winter rain coming, its suddenness has caught me on the back foot: in order to generate at all on a flow of 0.6 l/s, the SmartDrive had been set up with 18 pole stator and the rotor packed off maximally.  All this had to be changed and changed in the middle of a downpour: the 18 pole stator replaced with a 42 pole, the packing reduced and nozzles upped to match the greater flow available.

Despite my best efforts to have an orderly "take off" into each new water year when the rain comes, I have to admit I've failed this year.  I like to increase the nozzles in a steadily incremental way which matches as closely as possible the increasing flow. I don't like having to 'back track' to a smaller nozzle because I've put in too big a one. But a big element of getting things right is predicting how quickly the flow is going to increase and this year I've got it wrong; I've been beguiled by the torrent of water in the stream into which the turbine discharges (see pic below), and twice have put in too big a nozzle only to have to replace it with a smaller one within 24 hours.  I've been slow to follow my own adage that a source coming from a spring increases its output only gradually as ground water builds up; that I must not be misled by the early 'flashiness' of the run-off which appears in the stream.


In an attempt to bring a system to nozzle changing, I try to bring in a bit of measurement so the process becomes less of a guessing game.

For each nozzle I like to think I know what discharge the orifice will give; but in reality I know the accuracy of the figure will probably not be very good.  The lack of accuracy arises because the way of calculating the discharge involves a formula and that formula has rather too many inputs which are not known with great precision; the formula is:


Q  = CD x Anoz x √ (2g x Hn)
where: 
Q is the flow from the nozzle (m³/s)
CD is the discharge coefficient for the nozzle (dimensionless; I take its value to be 0.91)
Anoz is the cross sectional area of the orifice (m²)
Hn is the net head (m)
g is 9.81m/s2


The term which is easiest to tie down in this formula is Anoz. By using the taper gauge that EcoInnovation supply in their tool kit, or a 'small hole gauge' and a vernier calliper (see here), the diameter of an orifice can be fairly accurately measured, and from that the area calculated. 

The difficulty comes with the other two terms: CD and Hn; as the orifice size changes so will the values of these two terms; but it is too complicated to try to measure them for every size of orifice; it is easier to assume constant values and recognise this will introduce an inaccuracy to the value calculated for Q.

With this limitation in accuracy admitted, my orifices are so arranged as to have a difference in flow between one and the next of about 0.3 l/s.  The smallest orifice, Roman numeral # 1, is cut to deliver 0.3 l/s.  By keeping this nozzle permanently in the top nozzle position and bringing it into use only when there appears to be sufficient water to be able to use it, I can test whether the time has come to increase the bottom nozzle by another 0.3 l/s increment: - if I find that employing # 1 causes the header tank to stop overflowing, the time to up the bottom nozzle has not yet come; but if the header tank still overflows, I can up-size the bottom nozzle.


Intuition might say that employing nozzles of markedly different size in the top and bottom positions is a bad thing.  True, it will produce a vector thrust which has to be born by the bearing on which the shaft is carried; a vector thrust which is cancelled by an equal and opposite force if the two jets are equal in size.  But the size of this thrust when calculated at the bearing is small and is unlikely to be a factor in limiting its life. 

The more important consideration relates to the velocity of the water in the two jets; it may be counter-intuitive, but the velocity is actually the same.  This comes about because jet velocity relates only to net Head, not to orifice size.  So the two jets actually deliver water to the pelton cups at the same velocity even though one is delivering more mass of water than the other.  Having the same velocity, the relative velocity of each jet to the speed of the runner is the same for both jets and this is what is important for good pelton efficiency.


As I finish writing, it has not rained for over 24 hours; all today I've been running on nozzles # 1 and # VIII delivering respectively 0.3 and 1.6 l/s, and giving 448w into the grid; the header tank is still overflowing and the forecast is for no more rain for several days.  With that forecast, the likelihood is my next move will be to turn off # 1.

It's good to have a plan but better still would be to have more rain !

Monday, 7 March 2016

Harvesting energy

Harvesting is a seasonal affair.  Whether the crop be potatoes, apples or kWh's, there is a season when the bulk of the crop is gathered in.  For my Powerspout the season for harvesting most kWh's is now showing signs of tailing off.

In the past seven days, I have seen the energy generated fall from its maximum of 18.86 to 13.82 kWh's per day, these figures representing the energy yield when instantaneous power is 786 and 576 watts respectively.

To track the diminishing water as tightly as possible requires having a series of nozzles of different sizes: - the available flow is steadily diminishing in a linear fashion but reducing the flow to the turbine necessarily has to follow a step-wise pattern as successively smaller nozzles are employed. 

The way I operate my Powerspout is to have a small nozzle at the top position and a large one at the bottom.  The top one delivers just 0.3 l/s and I never change this one, only turning it on or off.  The bottom nozzle delivers most of the flow and is always on. It has to be changed when in-flow to the header tank falls to be less than the nozzle's delivery rate.  

The difference in size of the orifices is really quite small, - just a difference in diameter amounting to fractions of a millimetre as the picture below shows.  


The nozzle I'm using at the moment is the one missing from the line up above: nozzle X; it's in the bottom position with the top, small nozzle turned off. Here it is in operation this morning, delivering 2.13 l/s and putting 576 watts into the grid:


As I go down through the nozzles, I'm measuring the speed of the turbine at each flow to see how far off the 'sweet spot' speed ( i.e. the optimum speed) the pelton is operating at:


The theoretical optimum speed* for my installation is 1200 rpm near enough, so with the rpm being 924, the operating rpm is 23% below optimum speed.  As discussed in an earlier post, whilst this is not ideal, neither is it as bad as it might seem.  The efficiency of the pelton in converting pressure energy into rotational energy is probably only diminished by 5% by operating at this slower than optimum speed, and this 5% loss of efficiency translates into a loss of about 30 watts, or 0.72 kWh in a day.  I think I can live with that though it would be nice to think of a work around to improve things.

Whilst the harvest of kWh's from hydro generation seems to be ending its season, the good news is that the harvest from solar panels is just starting.  I look forward to seeing how well the two blend their respective outputs and will report the outcome at the end of the year.

* to calculate theoretical optimum speed: 
1. calculate jet velocity (m/s): Vjet = 0.96√(2g x Hnet)
2. calculate optimum runner velocity at pcd (m/s): Vpcd = 0.46 x Vjet
3. optimum speed (rpm) = (Vpcd / 0.69**) x 60

So for my installation: 
Vjet = 0.96 x √(2 x 9.81 x 53) = 30.96 m/s
Vpcd = 0.46 x 30.96 = 14.24 m/s
optimum speed = (14.24 / 0.69) x 60 = 1238 rpm

** the pcd (pitch circle diameter) of a Powerspout pelton is 220mm; 0.69 is the circumference, in metres, of the circle having a diameter of 0.22m.


Thursday, 27 August 2015

Cutting nozzles

There's a bit of an art to cutting Powerspout nozzles, at least if you're trying to get a precise diameter of orifice so it delivers a precise flow.  

I don't know how others do it but my technique is to mount a blank nozzle in the chuck of a wood lathe and serially slice off discs until the orifice diameter is exactly the size I want. Being hollow cones, the more you cut off, the bigger the orifice. I have the lathe turning as slowly as it will go and the knife needs to be as sharp as possible.  It's rather too easy to take off too much and end up with an orifice which is bigger than you intended.  


Measuring the resulting hole with real accuracy requires a "small hole gauge set".  Such a set provides a series of gauges which open up a 'split ball' until its diameter is just capable of passing through the orifice you have cut.  A micrometer is then used to measure the diameter of the split ball to the nearest 0.02mm.


The quality of the jet emerging from a nozzle is an important factor contributing to getting maximum efficiency from a runner, be it a pelton or a turgo runner.  The surface of the jet should be smooth and the jet should remain compact and not break up too quickly after emerging from the orifice.  To get such a jet, a good orifice is crucial and by cutting the nozzles in the way I do, a really clean edge is obtained which makes for the sort of jet you want.


The reason for cutting new nozzles, and bigger ones than I usually use, is because for the coming generating year 2015/16, I plan to use only the bottom jet.  There is greater efficiency to be had if you can deliver the flow through one nozzle rather than two and if that nozzle is the bottom one.  This is because the energy loss associated with nozzles is confined to just the one nozzle and being in the bottom position, splash and spray fall downward away from the runner, preventing rotational energy being sapped by the drag of the pelton rotating through water laden air.

EcoInnovation have in the past stipulated that power should not exceed 400W with single jet operation but Michael Lawley has indicated this is not a hard and fast rule. For my set up, I should be OK on one jet all the way up to design power of 750W (which is at 3 lps, and this should be provided by a nozzle orifice of 11.5 mm if my calculations are right !).  

So that's why I've been cutting new and bigger nozzles: - to meet this plan for generation in the coming year.  There's nothing like having a plan !

Sunday, 24 May 2015

One jet or two: the bigger picture

In my last posting, I mentioned that experimentally I have found more power is produced by one jet than by putting the same flow through two jets, and that this was contrary to what I had previously supposed, - a supposition based on this graph from the advertising literature of a long established UK manufacturer of pelton turbines:


Here is another graph addressing the same matter but which shows a completely different picture: (it is reproduced with permission from Practical Action Publishing and is taken from Jeremy Thake's book "The Pelton Turbine Manual") 


Although the axes of the two plots are labelled slightly differently this should make no difference to where the '1 jet' line lies in respect to the '2 jets' line, and yet the graphs display the lines in such a way that the two plots do not at all concur with each other in the story they set out to tell.

So wherein lies the truth? So far my experimental findings support the second graph.  I am continuing to take measurements to see if more readings will confirm this but at this stage Jeremy Thake's graph is the one which seems correctly to illustrate how a Powerspout performs in a low power / low flow situation.

Addendum written 28th May 2015: following correspondence with Gilkes, the long established UK manufacturer of pelton turbines referred to above, their Hydro Sales Manager has kindly explained that their graph is attempting to illustrate the benefits of installing a smaller runnered twin jet turbine vs. a larger runnered single jet turbine.  It is not looking at jet performance of single vs twin on the same runner.

Therefore, I misinterpreted their graph and used it to draw the wrong conclusion. The truth is that, when considering a turbine where either one or two jets can be employed,  at low flows single jet operation is better than two. 

Flows are still holding up surprisingly well here giving a daily output of 11.44 kWh on a flow of 1.9 lps.  This means I am operating around the 60% point in terms of 'Output Power' or 'Percent of full Flow' (depending on which graph you refer to).  Whichever graph one uses, at this 60% point, there is little difference between one jet or two and so I am not getting much opportunity to obtain further readings to confirm one jet is better than two at the present level of flow.  I happen to be operating with two jets at the moment, with most (1.6 lps) going through the bottom jet because it is the more productive, with just a little (0.3 lps) through the top jet.

During this past week it was meter reading day again, necessary in order to claim the next quarter yearly payment of Feed in Tariff. Rather a low number of kWh's have accrued since the last reading submitted in February: just 838 kWh, representing 53% of what could have been generated had there been sufficient water for full flow.

But one can't complain: if it doesn't rain, there isn't anything you can do about it !  What one can do, and this is what I have been working on recently and will report later, is to maximise the efficiency of the turbine.  Checking the balance of the pelton runner (a spare one) was one aspect of this, using this crude but effective set up:


The runner proved to be very well balanced !