6.48 mm diameter nozzle delivering 0.91 l/s to the runner which is rotating at 1084 rpm and generating 225 watts into the grid at an overall efficiency of 47%.

Sunday 27 December 2015

End of 2015 reckoning

At the end of a year, it's nice to look back on how one's hydro has done and compare the performance of the past year with previous years.

Here's a type of graph which does that by presenting the data in a pleasingly simple way:


I've chosen to plot 'water years' of output for a reason: had it been calendar years, each year on the first of January the turbine would be certain to be producing maximally in each and every year.  The result on the graph would be that all the plot lines would overlie each other.

By using water years, for which the start date is 1st October, the plot lines become separated because on that date and for some time after it, there is quite a difference in the output depending on how wet the autumn here is proving to be.  Thus in the graph above, water year 2 didn't see any generation until November 11th, whilst year 1 started on October 17th and year 3 carried on from the end of year 2 without a break.  Once year 2 got going, generation came in strongly, as strongly as year 1, as is indicated by the same slope for the two years up to about March 18th when the line for year 2 begins to fall away from that for year 1.

The plot also shows other interesting features:  
  • in water year 2, generation continued throughout the 365 days of that year, unlike in water year 1 when generation had to stop on July 7th.  Yet the extra number of kWh's added to the year's total by continuing to generate through the summer months was minimal: precisely 175 kWh over about 80 days.  And overall the year failed to make the total of the previous year despite generation continuing through the summer.
  • in water year 3, which has only just begun (green line), maximum generation has been tweaked to be slightly more than the previous two years: peak power now is 782 W as against 750 W. The result is that the slope of the green line is steeper than for the other lines and it has started to cross them as generation in year 3 accumulates kWh's ahead of the rate in the other two years. I wait with keen anticipation to see how it progresses as the year unfolds.
So I end 2015 with clear evidence that water year 2 was not as good a year as the previous one, but with the hope that the new water year just beginning is showing great promise.

The target I'm hoping to hit at some time in the future is a year with 4000 kWh generated !


Saturday 19 December 2015

The system at full stretch

Minimal script in this post to counterbalance the wordiness of the last two,-  just pictures taken this morning of the system working at full capacity:
Gathering the flow

Removing the trash

2.84 lps bottom jet, 0.3 top jet; 1200 rpm

Spent water returning to the stream
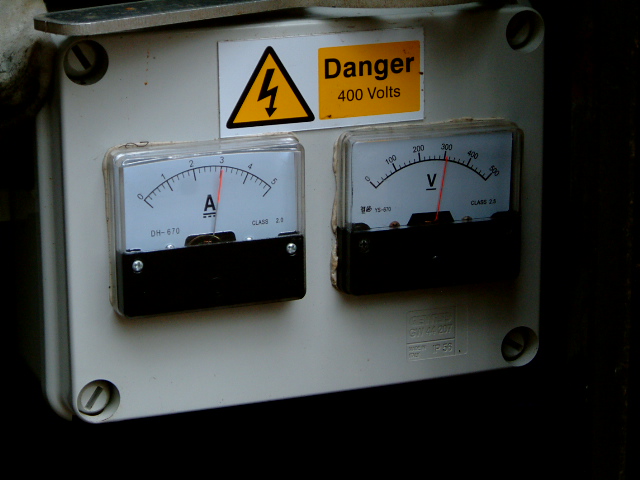
3 amps;  305 v dc

Relative humidity 33%, temp 26.8 ℃ (ambient 95%, 14℃)

Working in turbine mode

302 v ± 3  - very steady cf MPPT mode

Wattson: my in-house visibility of output

Sunny Beam: my in-house visibility of cumulative energy

Wattson Anywhere: my on-line visibility of power and energy output, captured the following day


The really accurate figure for energy output for this one day was 18.78 kWh, giving a mean power output of 782.6 watts.  The Wattson and SMA data seen above are not so accurate. The whole system efficiency for the day can therefore be calculated to be 47~ 48% (782.6 / [53.6 x 3.14 x 9.81] ), the inverter efficiency to be 85 ~ 86%, and the pelton/alternator conversion efficiency to be 55 ~ 56% ( [3 x 302] / [53.0 x 3.14 x 9.81] ).

With the whole system efficiency coming in at 47~48%, there doesn't look to be a significant improvement over last year (see here) when I was running in MPPT mode and two equal sized jets.  So maybe turbine mode and having most water coming through one big bottom jet doesn't confer any advantage.

Thursday 10 December 2015

Thoughts about inverters: Part 2

This post is best read after having read Part 1.

When an inverter starts accepting power from a Powerspout and feeding to the grid, an electrical circuit is completed.  In this circuit, the source of power is the SmartDrive alternator and the inverter is the load (resistance)*.  

In common with all circuits, the resistance in the circuit will determine the current. But in this circuit, unlike in other circuits where the source of power is a source which gives constant voltage, eg: a battery, a change in resistance here will not only determine the current but also the voltage.

The reason for this is to be found in the behaviour of permanent magnet alternators (PMA's).  With a SmartDrive PMA, the voltage it puts out is affected by two factors: rotational speed and load. Thus:
  • the voltage output is directly proportional to the speed of revolution (rpm).
  • the voltage output per revolution (v/rpm) is inversely proportional to the load in the circuit.

So here we have a circuit where the load (the inverter) is variable and can set the voltage by changing the resistance it places on the circuit.  As an aside, we should note that since one determinant of voltage is rpm, the inverter also has some control over the speed of the turbine.

The question to be answered now is: by what process of logic does the inverter decide what load it places on the circuit ?  And the answer is there are two control techniques which are possible, variously named and described as follows:
  • MPPT mode (maximum power point tracking) aka: Iterative / adaptive / intelligent load control, -  primarily designed for optimising output from PV.  To quoteSolar cells have a complex relationship between temperature and total resistance which produces a non-linear output efficiency. It is the purpose of the MPPT system to sample the output of the PV cells and apply the proper resistance (load) to obtain maximum power for any given environmental conditions. Different methods are used to find the optimum combination of voltage and current which will provide maximum power. In the "perturb and observe" method, the controller adjusts the voltage from the array by a small amount and measures the resulting power; if the power increases, further adjustments in that direction are tried until power no longer increases. This method can result in oscillations of power output. From Wikipedia (abridged)
  • Turbine mode aka table mode: primarily designed for optimising output from a rotating generator. In this method: The inverter regulates the input current by reference to generator voltage by using a 'look up' table.  This table, which can also be represented as a curve, defines the relationship which gives best ac power output for any prevailing DC input voltage.  The table, and also the curve, can be programmed by the user to best suit it to the particular turbine and alternator being used. From SMA WindyBoy literature (abridged)
As mentioned in Part 1, both of these control algorithms are to be found in SMA WindyBoy and SunnyBoy 1200 inverters.  Although I'm not familiar with other inverters, eg the EnaSolar range, I believe you can choose either mode in these inverters too.

In the 2½ years I've been operating my Powerspout, I've been keeping a record of the operating dc voltage, (sometimes called the MPPv or Vmpp, ie the voltage at the maximum power point).  For most of that time, I have had a SunnyBoy operating in MPPT mode as the grid interface, but for the past month I've been using a WindyBoy in turbine mode.  The turbine curve programmed into it is the default, factory one without any optimisation by me.

The difference in the way the two modes function is very clearly seen in the plot below of MPPv against ac power out to the grid.  I should add that all data points were taken using the same 42 pole stator: 60-7s-2p-star (which has a v/rpm of 0.509 v when tested in open circuit conditions).


It can be seen that:

  • MPPv trends down as ac power rises for the SunnyBoy, whilst the opposite is true for the WindyBoy
  • the scatter of MPPv for the SunnyBoy is wide, narrow for the WindyBoy

From these observations, it can be deduced that a WindyBoy holds the dc voltage much more constant and at a lower level than a SunnyBoy.  The plot also shows clearly why I had the problem I had last year when using a SunnyBoy, - the problem of MPPv rising to such a high level at low ac power output levels that it began to knock against the V Clamp's dumping threshold set at 378 v.  This was what prevented continuing generation at low water flows: - so much power got dumped, it wasn't worthwhile continuing. See earlier blog post here.

This year, I used a reduced core stator to get around the problem.  But it would appear that if I use a WindyBoy in turbine mode at low flow times of year, the issue will not arise. 

I never thought I'd hear myself say this: I can't wait for next summer's low flows to check this out !

*(addendum written 27/1/2016) Like all over simplifications, this statement, that the inverter is the load, compromises truth. All grid connected generators run in parallel with each other so that properly speaking the load is provided by the sum total of consumer load on the grid.  It follows that the inverter needs to behave as an 'open window' to the grid, transforming (from dc to ac) as much power to the grid as possible with minimal power being lost within the inverter. Nevertheless, the characteristics of the inverter (its impedance, its capacitance and its resistance) at any point in time have an effect on the SmartDrive output, and so this simplistic statement stands, but purely as a means of gaining understanding of how inverter and PMA interact.

Wednesday 9 December 2015

Thoughts about inverters: Part 1

Those Powerspouts which are connected to a national electricity supply are unusual amongst small water turbines in that they interface with the grid through an inverter. I don't know of any other make of water turbine which connects in this way. Small wind turbines more often do.

In the UK, as in other countries, there are strict regulations about connecting a privately owned generating plant to the national electricity network.  In the UK, these regulations are written down in the document: Engineering Recommendation G83 Issue 2 (August 2012).  It is commonly referred to as just G83/2.

In the original version of this document which was called G83/1 and was issued in September 2003, a useful distinction was made (which has been dropped in G83/2) between micro hydros connecting via an inverter and those connecting directly to the grid.  The former were designated Type A, the latter Type B:


There is a clever thing about Type A connection and it is hinted at in the diagram above. It is that a lot of clever electronics have been squeezed into one box. These electronics, both hardware and software, perform two main functions: 

  • converting power from dc to ac 
  • managing the grid connection according to the requirements of G83/2.  

The development work for these conditioning and controlling functions has been perfected by companies competing in the huge global market for inverters for the photovoltaic industry.  An inverter is, therefore, a sophisticated bit of kit whose price has been forced down by fierce market competition.  For what it is, it's a bargain.

The market for Type B connections is, by comparison with the solar market, tiny. Within this small market it is difficult to develop a grid connection package cheaply: economies of scale are absent and also there is such a variety of rotating generators available for type B installations (induction motors-as-generators, synchronous alternators, 3 phase, single phase) that standardisation is impossible.  Each has to be specially made for its location.  The price is high.

So all in all, Powerspout's use of a standard PV inverter is an elegant and economic solution to satisfying the complicated regulations of grid connection. It is surprising that other small hydro manufacturers have not followed the same route.  

There is, however, a not-so-clever thing about using an inverter: the electricity generated has to be changed first from ac to dc, and then back again to ac, - and at each conversion power is lost, making Type A installations intrinsically less efficient.  Lower efficiency means lower productivity, - quite significant lower productivity over the entire life span of an installation, and that in turn means a return on investment which is not as good. Perhaps this is the reason why others have not followed the same route.

The G83/1 document of 2003 foresaw that inverters used in Type A hydro systems would "normally be an adaptation of a PV inverter".  Today in 2015, it is evident that as a prediction this phrase wasn't precisely correct: the inverters recommended for use with Powerspouts are not adapted PV inverters but standard ones. They operate in the same maximum power point tracking (MPPT) mode that was designed for solar inverters.  EcoInnovation provide on their website 'compatibility tests' for several different inverters and all of them, they say, should be operated in MPPT mode as if they were handling power coming from an array of solar cells.

This adherence to MPPT mode for a Powerspout is something I have wondered about.  There is no doubt that it works and there is every reason to expect, theoretically, that it should control the speed of the pelton to the point where maximum power will be extracted.  But in the two years of running my turbine in MPPT mode, I have noticed that the way the inverter controls the turbine is not always all that it could be. In particular, the control of dc voltage at different levels of power output has given me problems.

Just recently, I have obtained a Windy Boy inverter.  As the name suggests, this was intended for interfacing a wind turbine to the grid.   Its electronic architecture is absolutely identical to the Sunny Boy but the way the inverter is programmed suits it better to a rotating generator rather than a photo-diode. The mode it operates in is 'turbine mode'.

The two modes, MPPT and turbine, are both programmed into all Sunny and Windy Boy 1200's. If you have the right computer connection cable it is possible to re-configure which mode your inverter will perform in. Not having this specialist cable, nor the expertise for the job of re-configuring my existing SunnyBoy, I was happy to find a second hand Windy Boy on Ebay which was already programmed in "turbine mode".

In the second part of this post, I want to try to explain as simply as possible my understanding of how an inverter controls the voltage output from a Powerspout, and illustrate how the two modes end up causing the package of inverter plus turbine to behave quite differently.

Saturday 28 November 2015

Temperature and output

I have been running the turbine without ventilating the electrical side to try to reduce condensation.  As a consequence, the temperature inside the compartment is higher.

In recent days, the temperature has been higher than usual because outside temperatures have been warm, and I began to notice that power output seemed to be drifting down as the temperature inside the compartment went up.

So I did an experiment.  Without changing any other factor which might alter power output, I re-established ventilation.  Over the next 40 minutes, the power output went up by by 6 watts.


Next day, to be sure this wasn't a fictitious observation, I reversed the experiment and blocked up the ventilation louvres again: the temperature promptly rose back to 30.4℃ and output dropped back to 616 watts.


OK, - so it's not an earth shattering observation, but nevertheless it's of interest.  The same effect is noticed and commented on (see page 5) in the report written for EcoInnovation's compatibility test for a Powerspout GE 400 coupled to an SMA inverter.

22 Dec 2015 Note added later: 
For the type of permanent magnet used in the SmartDrive rotor, which is ferrite ceramic, the flux density decreases linearly with increasing temperature. The obverse of this statement is that flux density increases with decreasing temperature. This would explain the above observation. 
3 Feb 2017 A further note:
The resistance of copper wire increases linearly with temperature; the impedance of the stator coils will thus increase with a rise in temperature and this too will affect the power leaving the alternator.

Tuesday 17 November 2015

Making use of what you generate

In the course of the last ten days, as the flow from the spring has picked up, output has doubled from 225 W to 518 W .

At 518 W, more than enough power is being generated to meet the 'base load' of our house, by which I mean the total load of all those electrical gadgets which are taking power in the background most of the time.  For us, 'base load' is made up of fridge and freezers, central heating pumps, lights, computers and a good number of small devices connected through mains rectified power units.  The total load comes to about 350 W, but it fluctuates, particularly depending on whether fridge and freezers happen to coincide their 'on' times.

So there is a surplus of generated power much of the time, and as water flow picks up further, this surplus will get greater.  What to do with it ?

Back in August this year, I had some solar PV panels put in, 3.25 kWp in total, and at the same time installed a Solar Cache, which is a device to divert surplus home generated power to useful loads 'in-house'.  The greater benefit of Solar Cache comes from diverting the huge amounts of surplus power arising from a sunny day, but it works just as well in diverting the smaller amounts of surplus hydro power.  By so wiring it that it registers the total of home generated power, it works seamlessly to divert power whether it is solar, hydro or a combination of both.

Here is a picture of the Solar Cache screen taken last night:


Taken as it was at 22.50, there was no solar generation and the 518 W indicated to be solar all comes from the Powerspout.  House 'base load' at the time is recorded as 197 W so there was a surplus available of 321 W.  The cleverness of Solar Cache is that it diverts as much of this surplus as it can to a useful load, whilst just maintaining a trickle of export to the grid.  From the screen, it is trickling 95 W to grid and sending 230 W to the immersion heater in our domestic hot water tank.

Under the feed-in tariff scheme implemented in the UK, payment for 'exported' energy is not calculated from a metered export reading but from a 'deemed' amount, which for hydro is 75% of energy generated.  Thus the way Solar Cache works which is to keep exported energy to a minimum (the makers claim around 50 W) does not mean that the revenue one receives for exported energy is reduced.

This, however, may be about to change.  In the UK, the government are embarked on a public consultation regarding changes to the feed in tariff scheme, and one of the questions in the consultation is:
"Given our intention to move to fully metered exports for all generators, do you agree with the proposal that new and existing generators should be obliged to accept the offer of a smart meter when it is made by their supplier?"

The effect of this change, were it to be implemented, would certainly reduce the income coming from a Powerspout, and this would be the case whether one had a Solar Cache or not.  A Powerspout installation, by the smallness of its output, will never generate sufficient for 75% to be exported, so any change from the present calculation method based on '75% deemed' will reduce income and prolong the 'payback time'.

But hey ! - it's not about the finances but the fun of having such an elegant source of home power.

Tuesday 10 November 2015

Managing moisture

It has been a busy few days with the Powerspout.  With autumn well on the way, the weather has been warm and wet.  The flow available to the turbine has been gradually increasing so I have been able to change from the reduced core stator to the 42 pole, full core one. This will now see the turbine set up for its winter period of peak output.

Whilst doing the change of stator, I also changed the bearing block.  I had to deliver on a promise to Michael Lawley that once winter flows arrived, I would run another trial of ceramic bearings.  The first trial was done in June and the bearings lasted just 4 weeks.

This second trial started yesterday, - and finished yesterday ! Just 8 hours !  Inspection of the failed bearings showed much the same as the first trial: pitted balls causing locking up of the race, but this time there was also abrasion of the PTFE spacer ring, leaving particles of PTFE everywhere.  I think this has to be the end of the road for the ceramic bearing dream !


In the course of this repeated delving into the turbine, I have progressed the idea of trying to run the Smart Drive compartment as dry as possible.  This I've done by stopping the ingress of moist outside air by blocking off the ventilation ports and de-humidifying the captive air inside with bags of silica gel.


The idea is to create a warm, dry environment for the electrical side which will inhibit corrosion and promote insulation.

It seems easily possible to obtain very low levels of relative humidity.  Ten bags of silica gel, each of 100g, brings the humidity down to just 10% within an hour of closing the housing, and this is with an outside ambient humidity of 98%.


The rise in temperature is to about 6 ℃ above ambient when the power output to grid is 300 W. At the reading showing this morning, 22.4 ℃, I am happy with this, although as power output increases in coming weeks, and with it greater heat output from the alternator, the rise in temperature will have to be watched.

To touch briefly on the theory of humidity and its relationship to dew point, if the relative humidity inside the housing can be kept at this 10% level and the temperature in the housing does not rise above 36 ℃, it will completely prevent any condensation (which is dew) forming on the bulkhead, even when the temperature of the bulkhead gets down to 0 ℃.  Since it is condensation forming on the bulkhead and then dribbling down over electrical components which probably causes most of the issues with insulation breakdown, this would be a significant advance.

The unknown will be how often the silica gel bags will need 're-charging', and the answer to that will be how often the compartment is opened allowing an air change with moist outside air.  I'll be keeping my inspections there to a minimum.

For those interested, 25 silica gel bags of 100 g cost £18.59 and a useful dew point calculator can be found here.

Monday 12 October 2015

The usefulness of a Power duration curve.

Even a small hydro installation has a nightmarish cost. Making the decision to proceed with a project can mean having sleepless nights weighing up if the installation is likely to yield a reasonable return on investment. The key word here is  likely. Unfortunately being sure what an installation will yield is something of a black art which needs good data.

In this post, I want to give some data collected over the first two operating years of my project which help in thinking about how productive a hydro is.  It is data which, had it been available before committing, - an impossibility of course!, - would have been very useful in deciding whether to proceed or not.  Yet even without being able to have this 'hindsight beforehand', I hope that for someone who is still considering their scheme, looking at things in this way might stimulate thought about how viable their planned installation might actually be.

The data is presented in the form of a graph which combines in one curve the flow characteristics of my source and the practical challenge of making the most of that flow through timely nozzle changes. It has to be remembered that with a Powerspout you have to work at matching nozzles to the changing flow, and how good you are at doing that is reflected in the productivity of the installation.

The type of graph is technically called a cumulative frequency curve. It shows the percent of time that specified levels of power output were equaled or exceeded during two successive "Water years", each running from 1st October to 30th September.  Such curves are called Power-duration or Power-exceedance curves. Here it is:


What is immediately evident is that the two years are not the same: year 1 (blue) was wetter, peak power was limited in that year to 711 W, and generation was curtailed by me not being able to generate below 200 W.  Year 2, (red) by contrast, saw maximum generation increased to 750 W and generation was possible all the way down to 95 W*, thus extending the percent of the year when there was an output from 72% to 90%.


Despite these improvements, the total output for year 2, which is given by the area under the red curve, was very slightly less than for year 1.  The actual figures were 3,216 vs 3,350 kWh.


The point to note from this is that no single year is necessarily indicative of productivity.  Only several years without any changes to performance will give a true picture.


In general form, the power-duration curve is not dissimilar to another cumulative frequency curve namely the flow duration curve (FDC) for my source.  Clearly the two curves must be related to each other since the yearly pattern of power production must follow the yearly pattern of flow. Here is the FDC for my source, with data collected over 12 months back in 2009/10:


What is not intuitively obvious is that the 'bridging factor' which links the two graphs is the selection of what the 'design flow'** for the turbine should be at this site.


Choosing the design flow is a critical decision and needs to be considered carefully.  A matter which will influence the decision is how capable the turbine is at operating over flows less than the design flow.  As a general rule, opting for a design flow which your FDC indicates will be present for at least 50% of the year is a good starting point but immediately this should make you want to make sure that the measurements for your FDC were taken in a typical year.  There is no way of knowing that to be the case without extending the measurement period over more than a single year and amalgamating the results.  And that all takes a lot of time and effort!


In my case, I went for a design flow of 3 l/sec***. This was a bit ambitious: as the FDC shows, such a flow is only available for a little over 10% of a year and looking at the power duration curves confirms this: full power was only available for 10 % of year 2 and 20% of year 1, (but the latter was a very wet year).


Having opted for a rather high design flow, I then paid the penalty of not being able to keep operating at the lowest end of the flow range, - although by year 2 I had got this sorted by obtaining a reduced core stator for the drier months. And this highlights one of the advantages of the Powerspout system that not getting the design flow right first time can be corrected later by changing the Smart Drive stator.


So, to return to where we started, it is not easy to predict with reliability what the yield, and therefore the return on investment for your scheme will be, but it is possible if you have good flow data, especially if the measurements are gathered over several years.  


Never has it been more truly said "without data, all you have are opinions".  For those bitten by the micro hydro bug this might be re-written "without data, all you have are dreams" !


*    see link for explanation

**  design flow is the flow required for maximum rated output.  For owners claiming UK Feed in Tariff, it therefore determines what you give as your Declared Net Capacity (DNC)
*** this flow at 53 m net head produces 750 W out of the inverter into the grid

Friday 2 October 2015

End of a "water year"

The end of September marks the end of what I call my "water year", by which I mean the twelve months which is centred on those months of the year when generation is maximal. 

Taking this span of time makes a graph of energy output look more tidy because each year begins and ends with the time of lowest output. Here is what this year's and last year's outputs look like superimposed on each other, blue for this year, red for last:


The totals generated in each of the two years were 3,350 kWh last year and 3,216 kWh this; not very different from each other. The pattern of peaks and troughs in generation are also not very different in the two years.

By the start of October I expect there to be too little flow to be generating so, because the turbine is shut down anyway, I generally set aside this time to do the yearly de-silting of the header tank.  This year however, as the blue line above indicates, a meagre daily output is still being produced, so today I have had to interrupt generation to get the job done:


The volume of water which has passed through the tank in the previous 12 months will have been in excess of 50 thousand cubic metres. With such a large volume, it is scarcely surprising that sludge collects but the amount I have scooped out today, when dry, would probably not amount to more than a tiny fraction of a cubic metre. So in fact the silt burden in the water is actually pretty low and a lack of abrasive wear on the pelton cups and nozzles reflects this.

My other bit of diary news is that I have just started on an experiment which has been stimulated by my last blog post entitled "Capping voltage".  There, I alluded to the problems of circuit board failures caused by dampness.  It has occurred to me that ventilating the electrical compartment with large volumes of moist air when there is a bulkhead kept cold by the temperature of the water on the other side, is a surefire recipe for creating wetness rather than reducing it.

So the plan is to seal the electrical compartment completely, pack all the spare space with
bags of silica gel, and see whether the humidity can be got down to a level where the dew point will never be reached however cold the surface of the bulkhead.  That's the plan but first there's a need to measure what the humidity and temperature are before the silica gel goes in. There's also the need to keep track of what the ambient temperature rises to in the compartment, especially as the level of power output increases over the coming months.  So I've made a little port hole through which to view a digital hygrometer / thermometer (£2.29 from ebay):


I'll report more fully later whether this 'sealed' approach reduces the wetness in the electrical side.

Thursday 10 September 2015

Capping voltage

In the two years my Powerspout has been operational, the only serious issue occurred soon after commissioning in September 2013.  The problem was a failure of the circuit board housed within the Powerspout casing.  Not one but two boards failed in quick succession. 

At the time, it was pretty disappointing, but I'm happy to give credit where it's due: -  Ecoinnovation were superb in their support both of me and their product, and readily honoured their warranty. They came up with a specially re-worked board encased in epoxy which has stood the test of time and is still the one in the turbine now.

Reading this week of a fellow Powerspout GE400 owner whose board failed in January this year, and for whom Ecoinnovation also readily provided a replacement under warranty despite it being 3 years after his original purchase, I thought the matter worth writing about.  The issue is likely to be something which, sooner or later, will affect anyone with a GE400 turbine.


An original circuit board in situ. The three phase rectifier block on the left acts only to protect the circuit board against possible back flow of power from the inverter.  It is not the main means of ac rectification.

To recap on what this circuit board does and why it is needed: 
  1. it changes the ac output of the SmartDrive alternator to a dc output for the inverter
  2. it ensures the resultant dc output does not exceed 400 volts by two means, the second being failsafe for the first:
    • diverting power to a water cooled heating element when voltage reaches 380 v
    • shorting the output if voltage reaches 400v
  3. capping of the dc voltage output is necessary because an inverter will be irrepairably damaged by voltages greater than its rated input voltage (400 v for the obsolete Sunny Boy 1200 but now 500 or 600 v for current Enasolar inverters)
  4. voltage WILL rise to very high levels when the turbine is unloaded and the electrical output is in open circuit because:
    • the pelton will accelerate to runaway speed (which is ± 1.8 x optimum speed)
    • the voltage output of a pma is speed dependent so as the pelton over-speeds, so over-voltage will result
    • it is a characteristic of pma's that they exhibit poor voltage regulation and voltage rises when there is no circuit connected to the output.
  5. such open circuit / unloaded operation of the turbine / generator is an inevitable occurrence which will happen every time the set is run up (because of the time it takes for the inverter to wake up and check the grid for compatibility before connecting) and every time the inverter disconnects from the grid for whatever reason.

So the need for voltage capping is unavoidable and the V-Clamp board pictured above and devised by Andrew Smithies was a really neat, failsafe and compact solution which tidily sat within the Powerspout casing.  


Unfortunately, that location within the casing was also its Achilles heel.  In spite of the slight warmth created by the alternator, in spite of the ventilation provided by the fins on the rotor, and in spite of giving the board a generous conformal coating of silicone, water penetration to the board led to failures:


Tell-tale ooze of melted silicone with underlying blackening gives away where the problem was on the reverse side of this board


With the silicone removed, there is clear evidence of arcing across the pcb surface between the terminals of this power MOSFET on this board


With circuit board removed leaving behind the white heat transfer paste showing where it was attached, the evidence for water trickling down from the board is clear.  

With several dampness related failures of the board, Ecoinnovation was forced to withdraw from its range the GE400 and other turbines using a similar board.  But with developments in inverter technology which saw inverters able to accept up to 600 v, together with using Smart Drive cores configured to deliver a lower operational voltage and thus lower open circuit voltage, things came together to keep the grid connected Powerspout as a viable option.

The need to cap voltage was not completely eliminated however and instead of the neat arrangement of having the board within the casing, this is now provided by a range of products which need to be housed separately. One of these products comes from a UK company called 2V Microsystems Ltd under their trade name Klampit and another is a product from Chinese company Ginlong.

Sooner rather than later, obtaining a replacement original V-Clamp board is going to be impossible.  When that time comes, moving over to a Klampit will probably be my best option but that will involve, for me, having to figure out where to house the extra components.  Being out in the open, I don't have the wall of a turbine house to mount these extras.

In the mean time, I am hoping that my epoxy encased 'special' will go on working for a while yet.  And in case it doesn't, I have carefully kept my two failed boards as they are repairable if not too badly damaged.  The secret is in knowing how to remove the generous coating of silicone: put the board in the freezer at -23 ℃ for a while and then it mostly breaks away leaving the components on the board pristine.  But be warned, lots of patience and several returns to the freezer will be needed.


My 'special' epoxied board, repair of which will never be possible.  Note also condensation on bulkhead.