6.48 mm diameter nozzle delivering 0.91 l/s to the runner which is rotating at 1084 rpm and generating 225 watts into the grid at an overall efficiency of 47%.

Monday 19 June 2023

A lesson learned

Even after 10 years, I am still learning about my Powerspout; today the lesson has been how minutely critical the alignment of the jet to the pelton wheel needs to be for maximum power to be generated.

My lesson came about like this: the turbine had been running very sweetly on 1.23 l/s, generating 331 watts into the grid, at a water to wire efficiency of 51.2%, - when I took it upon myself to disturb this happy state of affairs by putting in a wire-mesh grill; the grill was to sit beneath the turbine and stop me dropping parts beyond reach of retrieval when I do a nozzle change.

To slip the grill into place required the plinth on which my turbine sits to be lifted a very small distance, - but to lift the plinth requires the pipe manifold to be separated from the Powerspout casing, and to do that, the jet-cum-nozzle assemblies have to be removed.

No problem I thought !

After re-assembly, I was perplexed to find that the previous output of 331 W was now only 250 W, and the overall efficiency had dropped to 41.2%.

Nor did the turbine look or sound right; the splash pattern was not what it had been and there was the sound of some water missing the pelton and hitting the opposite wall of the Powerspout casing.

What followed was much experimentation with packing washers behind the runner, measurements using my knitting needle alignment tool (see this blog) and checking and rechecking what else could have been inadvertently put out of alignment.

Eventually, it was a hammer and a piece of wood that solved the issue, - by judicious tapping of the jet-cum-nozzle assembly whilst the turbine was running.

The tapping restored the original happy state of affairs by moving the assembly tiny amounts within the bounds of the hole in the casing through which the assembly passes, with these barely perceptible movements being judged good or bad only from observation of the splash pattern and from the sound the turbine was making.

Creating a Powerspout installation is a labour of love; having created it, everyone wants 'their baby' to generate as much as their site conditions allow; as this lesson teaches, it's worth checking that your jet alignment really is optimal.

Here are some pics to put flesh on the day's adventure:

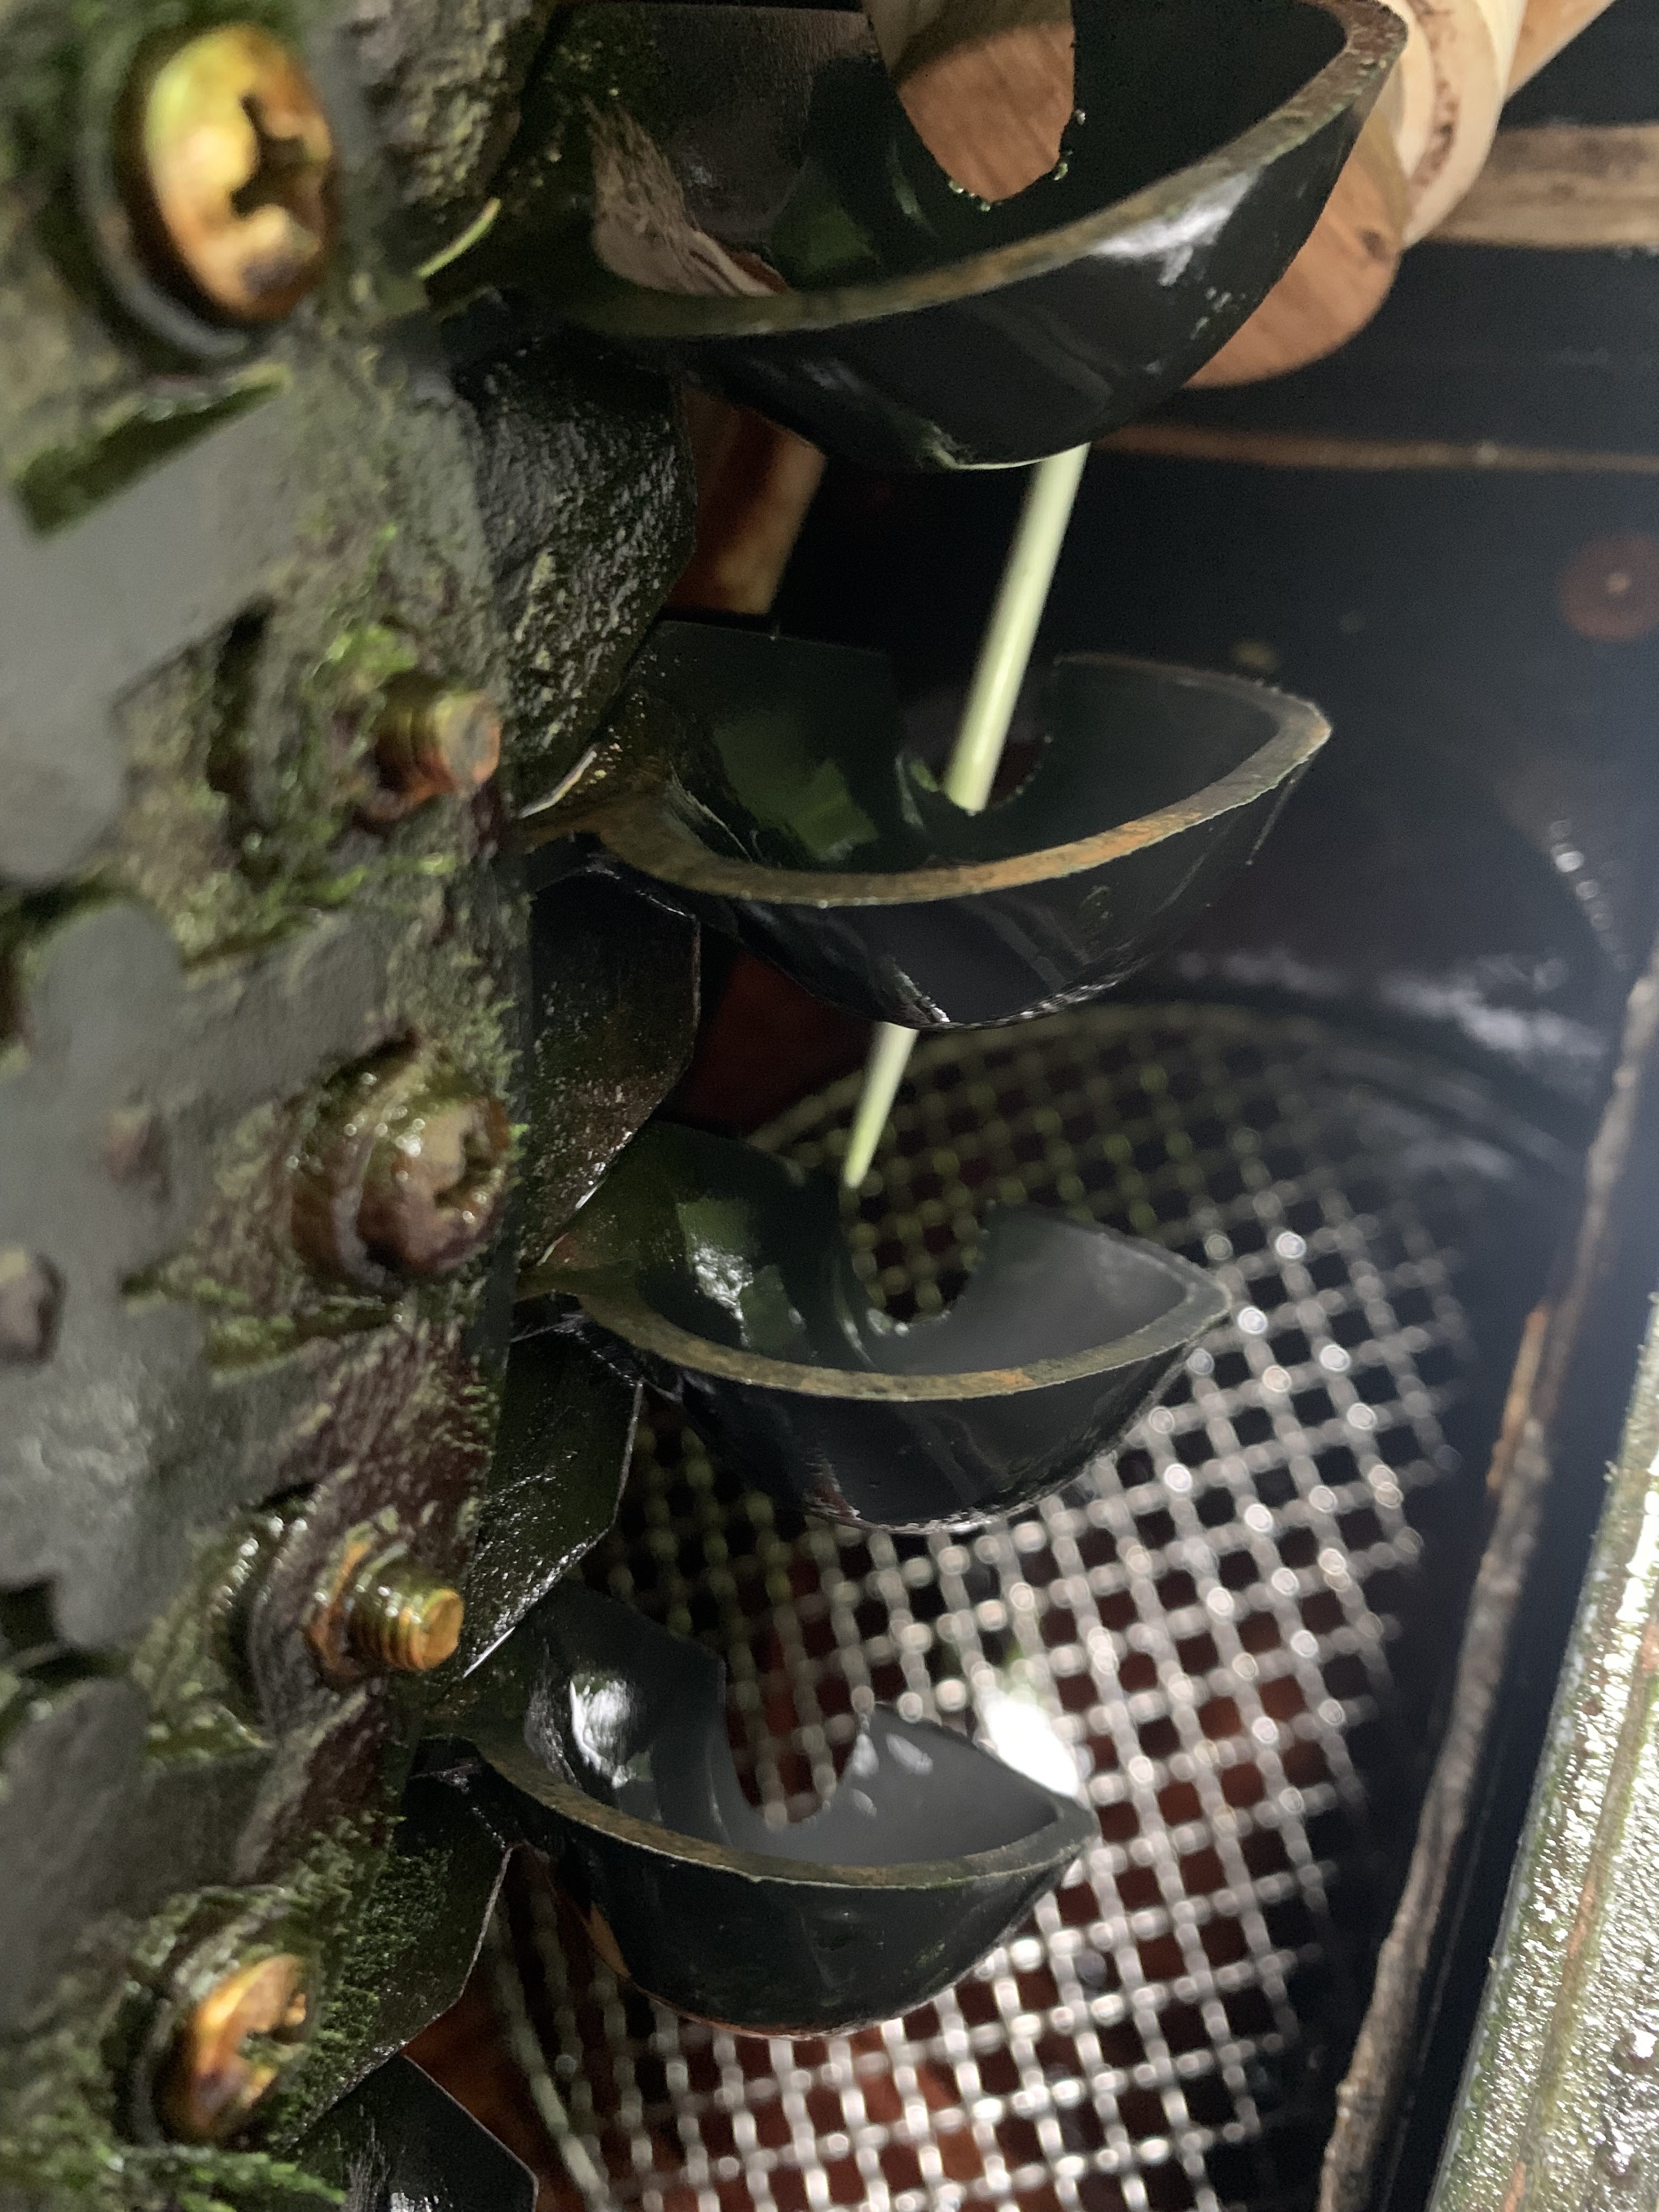
Wire mesh grill in place beneath where pelton runner normally is attached to the shaft.

Using knitting needle tool to optimise alignment of runner to centre of jet.


 "if all else fails, 'it it wi' 'ammer" !

Monday 12 June 2023

Optimising my inverter turbine curve

 The inverter that connects my Powerspout to the grid does more than just convert DC power to AC; by the load it imposes on the alternator, it determines the speed at which the shaft turns, and the speed at which the shaft turns is critical if a pelton is going to extract the maximum power from the head and flow of water available.

I run my inverter in what is called 'turbine mode'**; run like this, the load the inverter imposes on the alternator is determined from a 'mathematical table' stored in memory in the inverter, that tells the inverter how much load to apply depending on what DC voltage it is receiving from the alternator.

The 'table' is really an equation relating DC input voltage to AC output watts, and whilst a new inverter is delivered with a table chosen by the manufacturer, the table can be changed by the user.

A user might want to change the table because the factory parameters may not suit the performance characteristics of his hydro site, in particular the inverter may not allow the pelton to rotate at its optimum speed; the table in the inverter will work with the factory settings but it will almost certainly not work to produce the very best efficiency.

In a small hydro installation where power outputs are so small, tweaking efficiency to the best possible is a good idea to get the installation to be as productive as possible, and it has been for this reason I've been playing around with optimising the table in my WindyBoy inverter.

Without going into more detail than is necessary to explain how a table relating DC voltage to AC watts is constructed, some familiarity with Microsoft Excel is required.

The relationship between these two parameters is described by a single equation relating x and y, where x is DC voltage and y is AC watts.

The factory default table uses the equation: y = 0.0001x^3 - 0.0306x^2 + 2.92x - 83.

When this is plotted on a graph with x values chosen to be in the range of the DC voltage produced by my Powerspout, it produces the green curve in the graph:


Last year, I spent time carefully investigating what voltage produced the most watts output, for each of the nozzle sizes I operate my Powerspout with over the course of the year.

As a result of that exercise, I came up with a revised table, giving a revised curve, which is shown by the orange line. You can see it is a flatter curve than the green one and that at low power outputs (100 to 150 Watts) when the DC voltage is around 170 volts, the line starts to curve upwards without ever reaching the x axis.  The effect this had in practice was that at this low level of power output the inverter failed to connect to the grid, - presumably because the look-up table confused the inverter regarding the load it should be applying.

Last year therefore, I could not continue to generate with my smallest nozzle (0.53 litres/s) using the inverter with this table in its memory and I had to swap to another inverter which still had the factory default table.

This year, with summer progressing toward the driest time of year in September / October, I wanted to find a curve which would be able to work at this low flow. Playing around in MS Excel has yielded the blue line in the graph which I hope will do the trick.

You can see it almost overlays the orange line for most of its course, and that is good because it means it will make the inverter operate at the optimal points determined by my investigations last year, and crucially it does not start to curve upwards when power outputs are low.

Time will tell if my playing around has worked. Already in the few weeks I have been using this revised curve, when flows are still around 1.5 litres/s, there is a marginal improvement in power output compared to the orange curve, lifting water to wire efficiency by just one half of a percent! (53.3 to 53.8 %).

Every efficiency gain counts !

Here's a picture of loading the revised formula to the inverter from a laptop, running SMA's WindyBoy set up programme, and using SMA's USB Service Interface cable:


** Most inverters used for Powerspouts are solar PV inverters which are programmed to operate in Maximum Power Point Tracking mode; MPPT works for a hydro; but in this mode the inverter is constantly seeking the maximum power point, which for a water turbine is not changing, and so the output is seen to be constantly fluctuating when it could be a nice straight line.