It's been a dry year in 2022 and I've been itching to see what my year-end graphs look like. Remember, the year for me ends on September 30th, - a 12 month period I call a 'water year'.
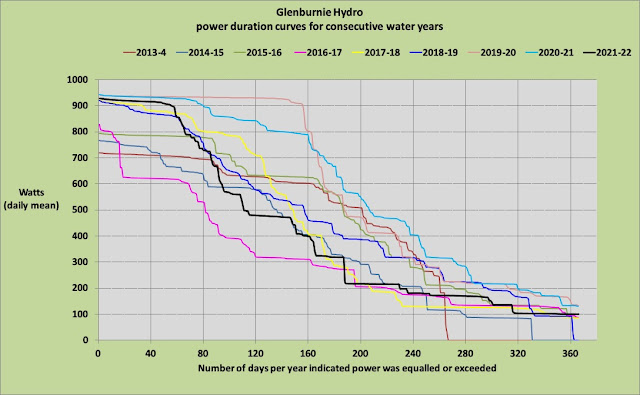
The bold black line in each graph represents the data from the past year:
1. Daily energy and power output
The solid stretch of generation that usually happens from November through to March never happened this year; only in early January and late February / early March was there enough flow to see the turbine generating at its maximum level of 900+ W; with rainfall being so poor, ground water was depleted for the rest of the year, and added to that, generation didn't see the usual pick up from a 'June monsoon', as happens in most years.
2. Cumulative energy (kWh)
With the year being so dry, unsurprisingly the total of kWh generated was a meagre 3599; only one year previously has had such a low rainfall, 2016/17, and in that year 2773 kWh was generated; the fact that more generation resulted in this year when a similar amount of rain fell, is because I've learnt since 2016/17 how to obtain greater efficiency from the system.
3. Power duration curve
4. Rainfall vs energy generated for the past 9 years
Despite groundwater keeping the numbers sweet by maintaining a reserve sufficient to keep the turbine running in drought times, this graph shows there is a clear relationship between rainfall and generation; from 2016 onwards that relationship is noticeably consistent; this consistency is not seen in the early years because in those years I was missing out on how much generation I could capture, - mostly from ignorance of how to operate the system optimally.
Conclusion
Every farmer has a bad year from time to time but always looks to the coming year to be better; that's how I'm viewing these results; already rainfall in September is higher than it usually is so it looks as if the next 'water year' should get off to a good start. With energy costs as they are, a good year would be nice.


