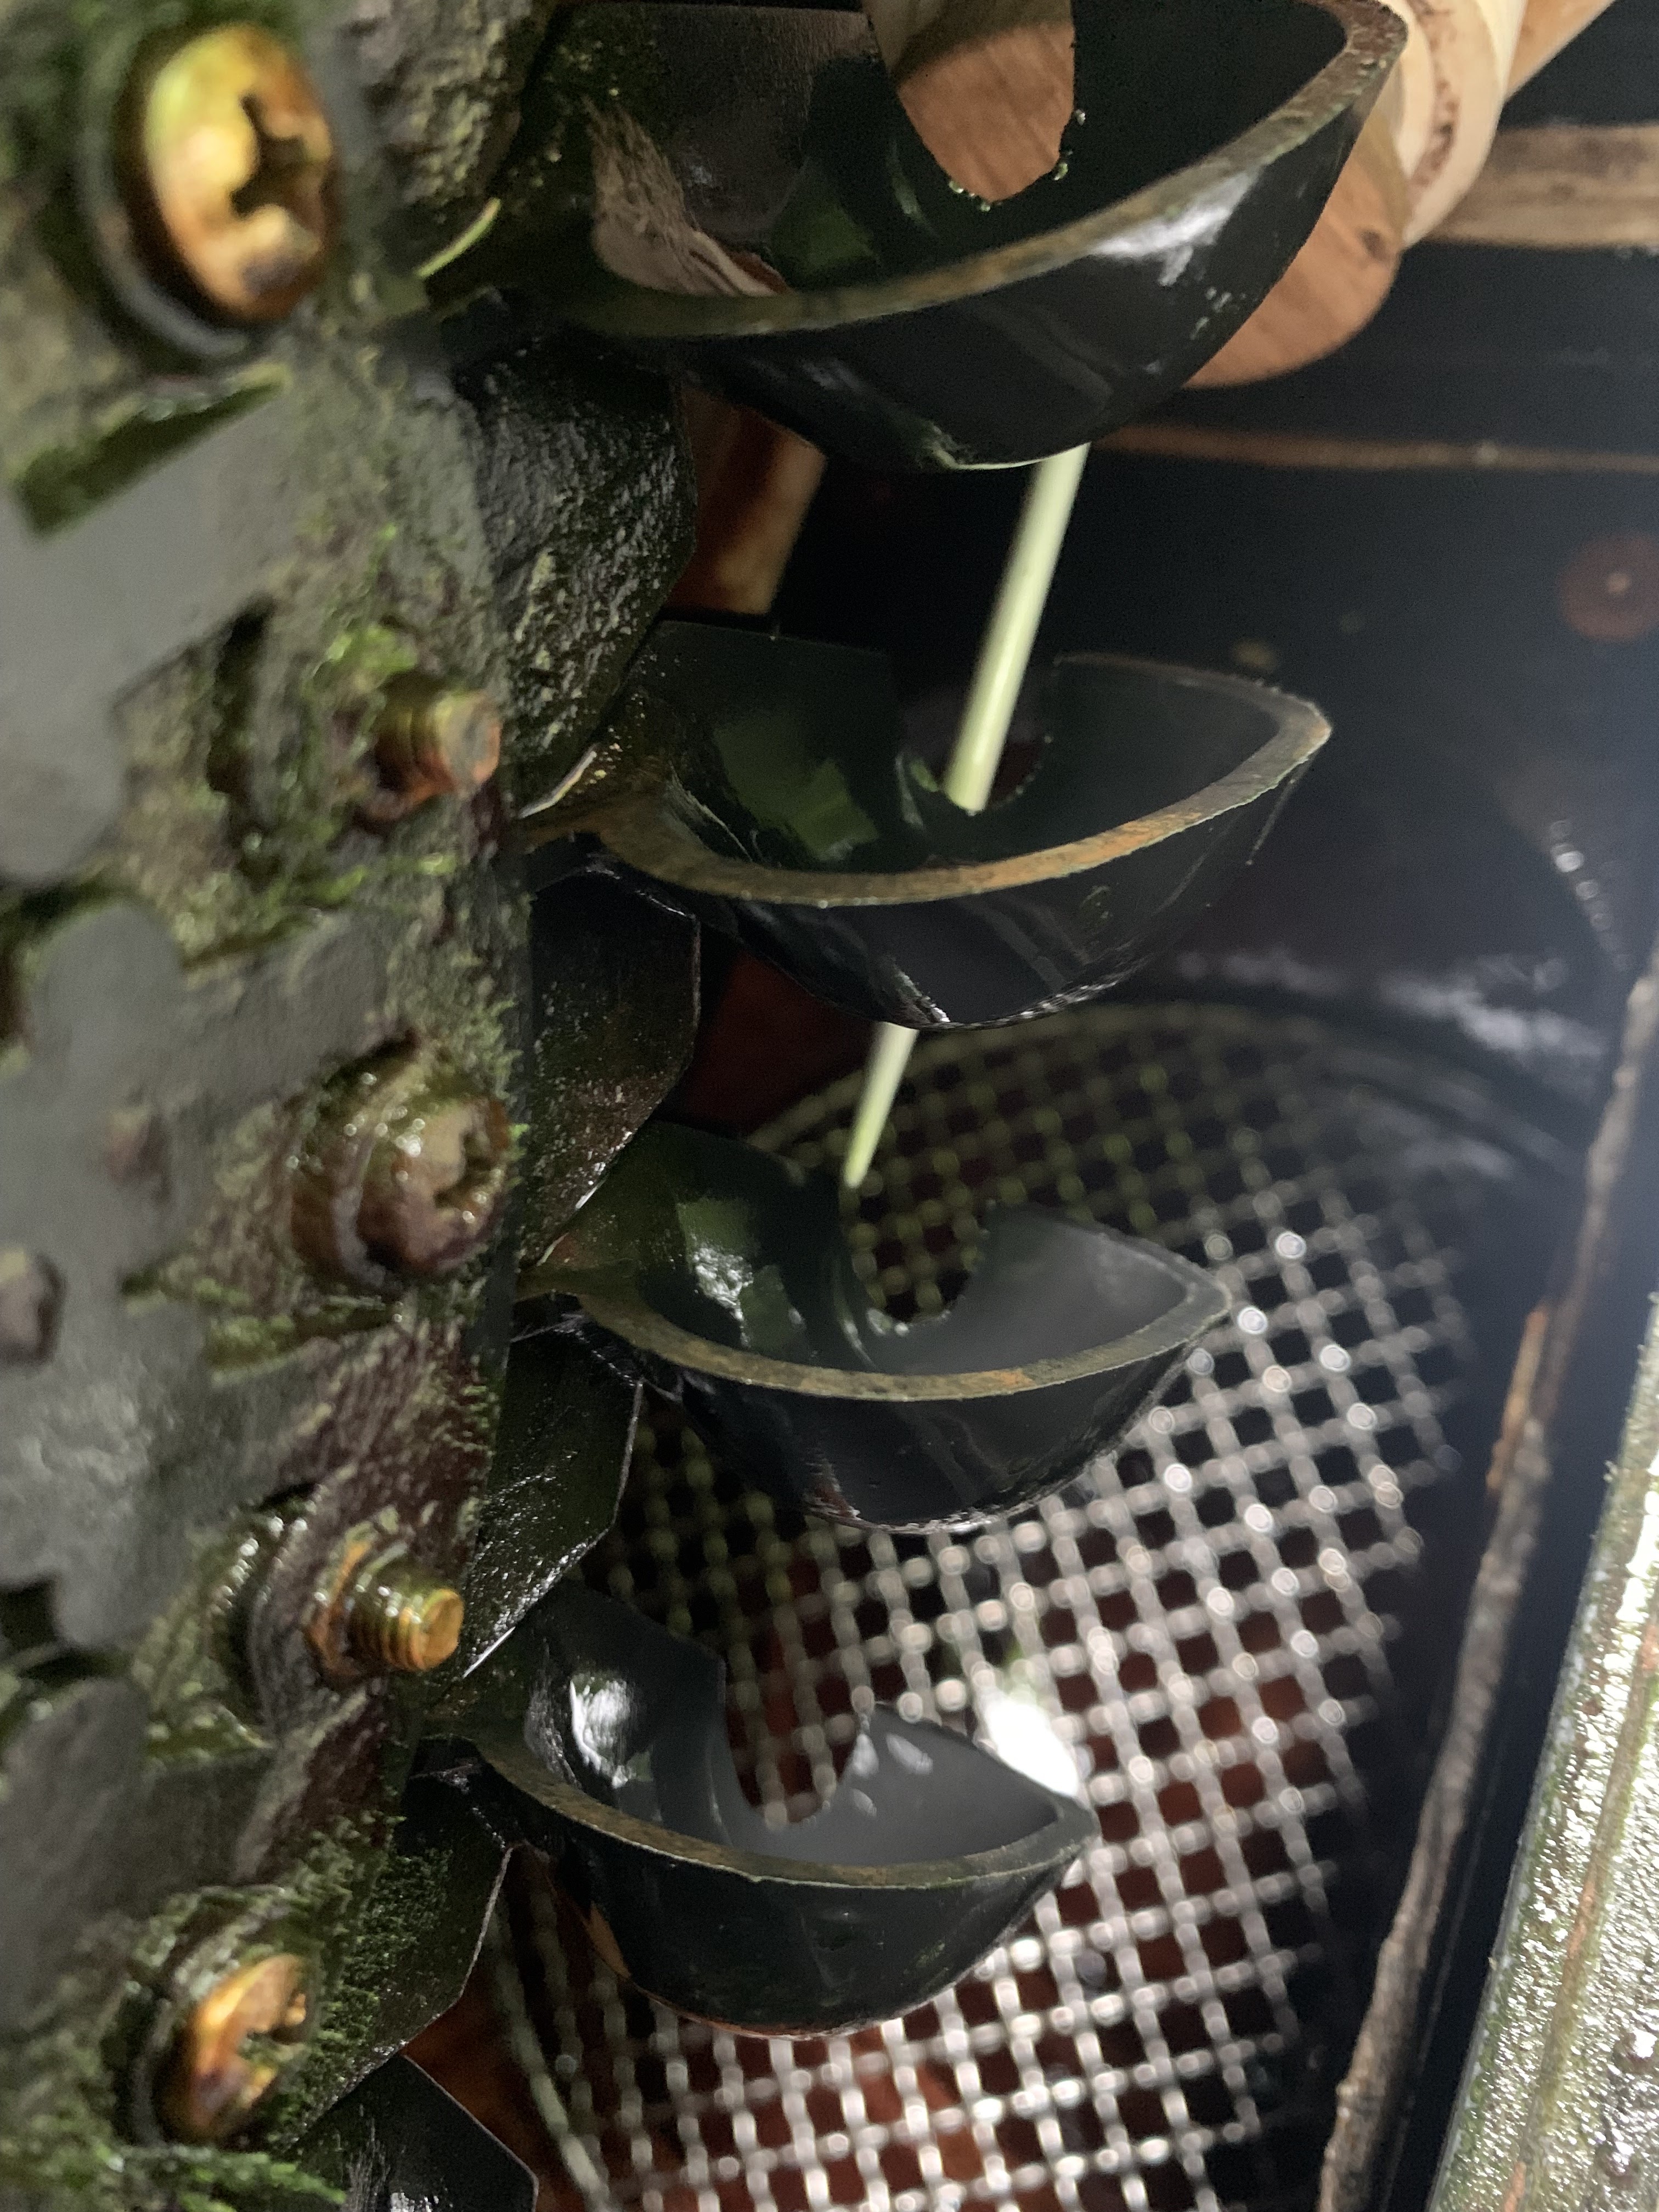
6.48 mm diameter nozzle delivering 0.91 l/s to the runner which is rotating at 1084 rpm and generating 225 watts into the grid at an overall efficiency of 47%.
Showing posts with label Productivity. Show all posts

Thursday, 1 October 2026

Year end results for 2025 / 26 water year.

Yesterday, September 30th 2026, was the last day of the 12 months which count as my "water year". 

By convention, water years do not follow the 12 months of a calendar year. Rather they start and end at the time of year when water is scarcest. 

In Wales where I live, the streams and rivers are always most depleted in early autumn, - from August onwards, - and only begin to have decent flows again when the leaves drop from the trees and rain starts to fall in earnest. It can be very variable as to when the rains start, but by selecting October 1st as the start date for the new water year, it is usually the case that the start and end of each water year falls in the driest time of the year.

I always look forward to September 30th because I can bring together the data from the previous 12 months to see how my Powerspout has performed, and especially how it has performed in relation to previous years. It is not a huge year-end exercise to compile the data because the data has been accruing each month from the inverter which acts as the DC to AC interface for the power the turbine is generating.

Here then, are the results for the past year. In each graph, the bold black line depicts the data for the past year.

1. Daily Power output (Watts)


2.Cumulative Energy (kWh)


3. Power duration curve (number of days which had power generated at different levels)


4. Correlation of Rainfall to Energy generated.


Comments.

The year was unusual for there being a few days, just 3, when the turbine did not run. In the 13 years of its operation, there have only been 3 years when this has happened. Strangely, those 3 days did not fall in 2026 when the UK had a very severe drought, but in late October 2025. In that year, there was low total rainfall (900 mm), the winter rains did not start until well into November, and as a result by the end of October, for just 3 days there was not enough water to run the turbine.

The total energy generated in the year (4047 kWh according to the inverter data but 4109 on the rainfall chart which uses the more accurate meter on which Feed in Tariff payments are calculated) was slap in the middle of the range that is typical for my site. As can be seen from the Cumulative Energy plot, there is a 'central band' into which the total for each year usually falls. In my data this band ranges from 3599 to 4534 kWh. There are then upper and lower bands when yield has been either exceptionally good (5132 to 5254 kWh) or exceptionally poor (2773 and 3155 kWh). This pattern of yield from hydros has been seen widely and probably results from irregular climatic events, such as El Niño. You can read about it in an earlier blog here, where I wrote about how it relates to calculating the Annual Asset Earning Potential for a hydro that has not yet been built.

Weather forecasters are predicting an El Niño effect for the UK over the winter months 2026/7 in which greater rainfall and cold temperatures are expected. I do hope they are right ! As the rainfall chart shows, where two years in succession each have high levels of rainfall, it produces in the second year generation which comes into the up-side band. 

Tuesday, 7 October 2025

Year end results for 2024-25 water year.

 For those few people around the world who search the internet for good data on how productive domestic scale micro-hydro is, here are my figures for the past year.

As years go, it has been a dry year in terms of rainfall, and the turbine's output has consequently been not as good as some years. The year end figures were saved from being too bad by the year starting off very wet and this meant that a good deal of the year's total energy was generated by the end of February. After that, rain became scarce and generation steadily declined for the remainder of the year.

Nevertheless, with 4534 kWh generated, I can't grumble.

In each graph, the bold black line represents data from the 2024-25 water year (Oct 2024 to Sep 2025).

1. Daily output (mean power W = total daily energy kWh / 24)


2. Cumulative energy output (kWh)


3. Power duration curve (number of days generating at measured levels of power output)


4. Whole year rainfall vs whole year energy generated.


Tuesday, 1 October 2024

Year end results for 2023-24 water year.

The year to September 30th has seen the most generation in the eleven years my Powerspout has been running. The total energy generated was 5254 kWh.

Understanding that this figure is really quite good for a small turbine is best captured by considering what is called capacity factor.

Capacity factor is the energy generated in a year divided by the energy that could have been generated if the turbine had run everyday for 365 days at the rating specified in its technical specification.

The rating specified for my turbine is 750 watts, which means the maximum power it is meant to be able to produce is 750 W. And using this figure, the maximum energy that could be produced in a year is 6,570 kWh (calc: 0.75 x 24 x 365).

So the capacity factor for the 2023-24 water year turns out to be near enough 80% (calc: 5254 / 6570 = 0.799).

But there is a slight deception in this figure. And this is because the maximum power my Powerspout can actually produce is more than 750 W, and this is evident in the first of the plots below.

There is a reason why there is this deception: the figure of 750 W had to be specified before the turbine had even been commissioned and was a figure derived purely from theoretical calculation. This theoretical calculation had to make assumptions about a lot of things such as friction loss in the pipeline, the efficiency of the 3 phase alternator, the efficiency of the dc/ac grid-tied inverter, ...and many more factors, - all of which were little more than educated guesses.

When the turbine actually got to run, many of the guesses turned out to be on the pessimistic side and the turbine actually was found to produce nearer 800 W at full flow, and even 900 W if slightly more water than the specified maximum flow of 3 l/s was used.

So the 80% capacity factor figure is inflated, and if the true maximum power of 900 W is used to calculate it, the figure drops to 66%.  But since officially my turbine is rated at 750 W, that's the figure I'm going to continue to use for my capacity factor calculations. But I will point out that in the interests of 'honesty and transparency' you'll notice that I do say in the Scheme Details section in this blog where each year's capacity factor is given, that the figures are "taking as datum DNC 750 W" (DNC = Declared Net Capacity).

For those who like to appreciate how a small scale hydro works out in the real world, here are the figures for this past year's generation. The year 2023-24 is the black plot line, and previous years are coloured lines:


Monday, 19 June 2023

A lesson learned

Even after 10 years, I am still learning about my Powerspout; today the lesson has been how minutely critical the alignment of the jet to the pelton wheel needs to be for maximum power to be generated.

My lesson came about like this: the turbine had been running very sweetly on 1.23 l/s, generating 331 watts into the grid, at a water to wire efficiency of 51.2%, - when I took it upon myself to disturb this happy state of affairs by putting in a wire-mesh grill; the grill was to sit beneath the turbine and stop me dropping parts beyond reach of retrieval when I do a nozzle change.

To slip the grill into place required the plinth on which my turbine sits to be lifted a very small distance, - but to lift the plinth requires the pipe manifold to be separated from the Powerspout casing, and to do that, the jet-cum-nozzle assemblies have to be removed.

No problem I thought !

After re-assembly, I was perplexed to find that the previous output of 331 W was now only 250 W, and the overall efficiency had dropped to 41.2%.

Nor did the turbine look or sound right; the splash pattern was not what it had been and there was the sound of some water missing the pelton and hitting the opposite wall of the Powerspout casing.

What followed was much experimentation with packing washers behind the runner, measurements using my knitting needle alignment tool (see this blog) and checking and rechecking what else could have been inadvertently put out of alignment.

Eventually, it was a hammer and a piece of wood that solved the issue, - by judicious tapping of the jet-cum-nozzle assembly whilst the turbine was running.

The tapping restored the original happy state of affairs by moving the assembly tiny amounts within the bounds of the hole in the casing through which the assembly passes, with these barely perceptible movements being judged good or bad only from observation of the splash pattern and from the sound the turbine was making.

Creating a Powerspout installation is a labour of love; having created it, everyone wants 'their baby' to generate as much as their site conditions allow; as this lesson teaches, it's worth checking that your jet alignment really is optimal.

Here are some pics to put flesh on the day's adventure:

Wire mesh grill in place beneath where pelton runner normally is attached to the shaft.

Using knitting needle tool to optimise alignment of runner to centre of jet.


 "if all else fails, 'it it wi' 'ammer" !

Monday, 9 December 2019

Asset Earning Potential

A big business thinking of building a new manufacturing plant or purchasing a new bit of equipment, will want to know what the earning potential for the new venture is. In no less a way, someone putting in a small hydro will want to know what the earning potential is and whether it makes financial sense to install it.

In big business, working out 'asset earning potential' is relatively easy because costs and benefits can be estimated.  But for hydro it's not so straight forward; there is the imponderable of Mother Nature: - years will be wet or dry, some very wet and some very dry.

Is it possible to bring systematic thinking to 'asset earning potential' under such circumstances ?

Some years back I heard a talk about the subject. It was given by Kieron Hanson who is a director of Hydroplan, an engineering and consultancy company installing hydros throughout the UK.  In his talk he put up this slide, headed AAEP, which stands for Annual Asset Earning Potential:


  • What it depicts (insofar as I remember his talk) is this:
  • for a hydro, there is a central value for AAEP which will be the average income, calculated over several years, that the hydro brings in
  • to factor in the normal variation in rainfall this AAEP will have an "upside" error band and a "downside" error band indicating the extent to which income will be affected by wet and dry years
  • the upside wetter years can be 12% above AAEP whilst the downside drier years 34% below 
  • exceptionally, years may be very wet or very dry leading to a greater variation from the AAEP central estimate than is seen in usual years
  • these exceptional years can increase income if the year is wet by 21 to 34 % above central AAEP but decrease it if the year is dry by 26 to 34 %. (where he quotes percentages, I'm not sure how they were arrived at).


So much for the theory.  Does it seem to apply in practice  ?

For my small hydro, rather than taking earning potential in money, I've looked at it simply as kWh's of energy generated; doing so avoids needing to 'monetise' the energy generated and therefore avoids thinking about feed-in tariff, and avoids also the monetary value of the saving being made by not importing grid energy, which is tricky to calculate.

For my scheme, the central AAEP in kWh's over the past 6 years has been 3575; the highest figure for generation has been 4083 and this gives an upside error band of 14%; the lowest generation figure has been 2773, giving a downside error band of 22%.  So my generation figures tie in quite nicely with what Mr Hanson's slide showed, - broadly similar upside and downside error bands compared to his predictions.

So far no year for which I have a full data set has been exceptionally wet or exceptionally dry. But the current year just started (my years run Oct 1st to Sep 30th) is looking very much as if it might be an exceptional year; the start is proving to be very wet. Here is the graph of cumulative kWh's generated, with the current year shown by the black line; I am updating it each month after having written this post:


It can be seen that the trajectory of the line is hugely different from any previous year. If it proves to follow the rule of the slide and be 34% over AAEP, the total for the whole year should come in at 4790 kWh. (note added 1st Oct 2020: as the graph shows, the total came in at 5133 kWh, 44% over AAEP).

Does any of this help with deciding if a hydro is worthwhile ? - not really ! But it should make one cautious about proceeding with a scheme on the basis of a single year such as this present one; such a year would give a false impression of how productive a scheme might be and make a borderline scheme have the appearance of being worthwhile when in truth for most years it may not be.

Saturday, 24 November 2018

Usefulness

There are just two measures of how useful any renewable energy scheme is:

- how many days in a year it runs
- how much it generates when it is running

In renewables parlance, the 'days run' are spoken of as being the availability factor and how much is generated over a year when it runs as the capacity factor. 


More completely described, the capacity factor is how much energy (kWh) is generated in a year as a fraction of how much could have been generated if the installation had run at its rated capacity for the whole year.  Thus defined, it can be seen that capacity factor incorporates a scheme's availability factor since if a turbine isn't running for some days (↓ availability) necessarily the year's output will be less (↓ capacity factor).

I read recently that in the UK small wind turbines typically deliver a capacity factor of just 15%, whilst PV panels manage 17%.  These figures reflect the obvious: the wind doesn't blow all the time (↓ availability) and when it does blow it doesn't always blow sufficiently to drive a wind turbine to its full rated output (↓ capacity factor), - and for PV, the sun only shines in the day not the night (↓ availability) and even then is not always bright enough due to clouds or inclination in the sky to give maximal output from the rated capacity of the array (↓ capacity).

Comparing these figures with those of my turbine over the past year sheds a rosy glow on how useful the turbine has been: having run for 365 days its availability factor was 100% and the capacity factor 58%. (see plot below)

Figures as good as these are unusual for a very small hydro and it's worth touching on some of the reasons:

  • the source is a spring whose flow comes from groundwater; a spring depends in a loose way on rainfall and is more constant in its output than a source using a watercourse, where the flow will closely reflect whether it has rained or not
  • my abstraction licence doesn't specify a 'hands off flow' - meaning I'm free to take all the flow available, even in the dry times of a year
  • by having an orderly range of nozzles of different sizes and maintaining a regime of changing between them to suit what flow is available, nearly maximal use of flow is achieved 
  • by using washers to make the rotor stand off from the stator with the aim of keeping the speed of the turbine up at low flow times, output is always maximal for the flow available
  • by swapping from a 42 pole stator to an 18 pole in the dry months, the turbine can be kept in operation at low flows; also its speed can be kept up by using an 18 pole stator beyond what is achievable by packing off the rotor with washers; the issue is caused by too strong magnetic attraction, for the torque available at low flows, between the rotor and the iron cores of the many poles when a 42 pole stator is in place 
  • by using a Type 2+ (high power rotor) at high flow times, turbine speed is kept down when otherwise it would go too fast for optimal output
  • a full range of spares kept on-site means days are not lost to generation by waiting for spares to arrive
  • a plan of preventive maintenance and a sturdy initial installation has so far eliminated prolonged down-time from unexpected problems


Capacity factor = (3816 * 100) / (0.75 * 24 * 365) = 58%

Availability factor = 100% (turbine ran 365 days: the one day showing no output is Feb 29th, included for spreadsheet reasons, but 2018 was not a Leap Year: hence no output shown that day).

Friday, 6 April 2018

Pictured yesterday...

Yesterday was a perfect cloudless day, - giving near maximum photo-voltaic output (19.54 kWh) on top of maximum hydro output (20.92 kWh) : total 40.47 kWh.  This concurrence of maximum outputs only happens at this time of year when water flow is still good and the sun sufficiently high in the sky to make the pv panels give close to their full rated output.  It also helps that the air is still cool, which boosts the output from the pv panels.  

For those discerning enough to note it, the asymmetrical shape of the solar output curve is because the orientation of the panels is ESE, - and they are located in the northern hemisphere.
😊


Tuesday, 13 June 2017

Work productivity - human and hydro.

Lately, the human kind of productivity has been encouraging but the hydro kind less so.  

To take the hydro kind first, - the line of the graph of cumulative kWh's generated for the current year continues to fall away from the trajectories taken in previous years:


...we have had rain, but it has been meagre and not done anything to increase energy output.  I doubt the year total will see 3000 kWh, - which would mean a 25% reduction on last year's total.

This disappointing output is not a result of any interruption in turbine operation, - it has run continuously with no interruption caused by the near miss of the tree falling next to it, - work on the clearing of which is the reason for the encouraging productivity of the human  sort:


The clearing away of the root plate of the tree is still a work in progress.  It's all being done with hand tools so it takes a while.

As I work on it, trying to remove each and every stone amongst the roots that will mean another sharpening of the chain saw's teeth, I keep telling myself "Rome wasn't built in a day", which alternates with "There are worse things to be doing in retirement"!

My thanks to my mate Paul, emptying his boot of saw dust in the picture. Without our arguments about how best to do the job, life would be less fun.

Saturday, 1 October 2016

Productivity viewed 3 ways

The ending of September brings to a close the 12 months I have chosen as my hydro 'accounting year', a period I have come to call a 'water year'.  In previous diary entries I've speculated as to whether I would reach the total I was hoping for of 4000 kWh; now the answer can be revealed !

There is an old saying which goes: "If you ask a man with a watch what the time is, he will tell you; but if you ask a man with two watches, he can't".  Something of the truth in this applies to my ability to reveal the answer; having two ways of measuring the energy total inevitably gives two different figures.

Below is a plot of the cumulative energy output of my turbine for the three water years it has been running; the data is captured automatically from the inverter; as can be seen it gives a total of 4,032 kWh:

But an inverter is not designed for the very accurate capture of data; there is an Elster energy meter also in the circuit which is more accurate, - as it must be for determining FIT payments on energy generated; and the total it gave was 4,168 kWh.

So, as the graph shows pictorially, even with its less than accurate total, the year just finished has exceeded both previous years.  A consequence will be that I'll probably exceed the amount of water I'm licensed to abstract in a twelve month period (it is calculated from the figure for energy generated); but since the accounting period for that twelve months is April 1st to March 31st, the matter will not arise until 2017.

Another way of presenting the data in the above graph is shown below.  Here, instead of plotting the cumulative total reached at each date, what is shown is the actual energy generated each day; this relationship gives an idea, not seen in the above graph, of the variation as the year's seasons come and go:


From this plot it will be seen that peak generation in 2015-16 (18.9 kWh/day) was higher than in the previous two years and also that generation continued throughout the water year, the first time this has been possible.  Both of these improvements resulted from gaining a better grasp of the science behind a Powerspout, the first by squeezing from the system a small improvement in efficiency and the second from using, in the drier months, a modified stator in the alternator.

The third and final way of looking at productivity is rather different from the above graphs but it uses exactly the same raw data.  People familiar with hydros are usually familiar with flow duration curves (FDC's), that type of curve called an exceedance curve which depicts what percent of a period of time, usually a year, a given flow in a watercourse is recorded as being present. 

These days, rather than measured flow data being used to construct an FDC, rainfall data and catchment area are used to compute the flow; computer calculated FDC's can be purchased for any watercourse in the UK, at a price, without the tedium of taking any actual measurements of flow; their accuracy is questionable, especially for the small streams a Powerspout might be installed on; yet the authorities responsible for licensing water abstraction in each of the national regions of the UK often insist on applicants providing them.

A curve called a power duration curve can be constructed in the same way as for an FDC but using power data rather than flow data.  Here is such a plot for the output of my turbine over the past three water years:


Such a plot is rather useful. Whilst it has all the same features evident in the two plots above, it shows in addition something not evident in those plots; it shows a characterisation of the annual flow in the watercourse, just as if it was a flow duration curve.  

For a site like mine where no 'hands off flow' is required, a provision which allows me to take as much flow as I can up to the design flow of the turbine, the shape of the power distribution curve will be almost identical to the flow distribution curve, at least in that part of the curve below the maximum power level. It will only be 'almost identical' for two reasons: because the system efficiency is reduced at very high and very low flows, thus making the relationship between output power and flow to be non-linear; and second because I don't always manage to take all the flow. But notwithstanding this limitation, it will be a far more accurate characterisation of stream flow than any FDC could possibly give, based as it is on daily electrical readings which are so much more precisely captured than water flow readings.

The usefulness of plotting a power duration curve each year will come over time.  If, as we are led to believe, Wales is going to get wetter as climate change happens, successive year plots layered over previous years should show clearly whether greater wetness is indeed happening.  It'll be a very, very, local investigation into the effects, if any, of global warming !

For anybody interested in learning how to construct exceedance curves, I found this pdf document on Phil Maher's Hydromatch site to be much the most helpful.

Thursday, 1 September 2016

Sun and water

The end of August sees the completion of the first full year of having both hydro and solar generation being harvested here where I live. In this brief post, I want to present the data.

The synergy of solar with hydro is well recognised: of benefiting from hydro in winter and solar in summer; so the pattern of yield for the two as seen in the graphs below comes as no surprise.

In the UK, the total amount of generation that can be contributed to the grid at one meter point is restricted, and although my Powerspout could never generate at its maximum at a time of the year when the solar panels were also generating at their maximum, the sizing of the solar array had to be limited to keep the sum of their peak outputs within the permitted total.

For this reason the array is less than the maximum normally allowed; it is a 3.42 kWp installation and its yield is reduced by being in a location which is not ideal, facing east-south-east (S60degE), on a roof pitch which is rather flat (30deg).

Nevertheless it does the job nicely of keeping the energy generated each month in summer up to the peaks the Powerspout reaches in winter.  Totalled over a full year the hydro generates more which, considering its design rating is just 0.75 kW vs the 3.42 kW of the PV, says much for how productive small hydros working 24/7 can be.


A finishing thought: the sun does it all ! - energy from the sun is the source of both solar and hydro generation; were it not for the sun taking water as vapour from sea level up to the sky so it can drop on the hilltops as rain, not a hydro installation in the world could work.

A post script to my last blog post: I have had much interaction with NRW since writing about my 'grievances', all of it good and positive.  Having been decidedly critical in that post, I just want to put on record my thanks and appreciation to all those, from the member of the board downwards, who tolerated with good grace what I wrote and are looking into some of the points I raised. Diolch yn fawr.

Thursday, 25 February 2016

How significant is the contribution from a Powerspout ?

There are, by my reckoning, at least eight small hydro installations within a radius of 5 miles from where I live.  Most are in the 10 to 20 kW range and most are owned by farmers who have seen the economic sense of generating their own electricity.  Here are two of them:
This one is a twin jet Hydrolite turgo unit driving a vertically mounted induction motor giving 8 kW into the grid.


And this is an Ossberger crossflow turbine, again driving an induction motor as generator, with a full flow capability of 30 kW.

These machines have been put in for one reason: to earn money. The income they earn from the favourable government scheme which, until recently, we have had in the UK, means that such 10 to 20 kW installations can provide a very useful new income stream, - a source of farm revenue which is diversified away from the main source of agricultural income.

By comparison with these machines, my Powerspout looks almost like a plastic toy, and being rated at just 0.75 kW at full flow, it is not surprising that many people cannot believe it makes a useful financial contribution. Certainly in terms of income arising from the government 'Feed in Tariff' scheme, it is true the cash return is nothing like what my neighbours are getting.  But a very small turbine has a hidden advantage over its bigger cousins.

This week I received my electricity bill for the last quarter, the quarter which runs from Nov 19th to Feb 19th.   Here it is:


As you can see the total energy consumed was 289 units of day-rated energy and 89 of night-rated, making a total of 378 kWh.

I know its rather sad I do this but I've been keeping records of electricity consumption since we moved here in 1992. Plotting the consumption for each first quarter since 1994 gives this graph:


The figure for the latest quarter, 378 kWh, is seen at bottom right, and is the lowest first quarter consumption ever, lower even than the two previous years during which the Powerspout was operational.  (in case you're wondering why the consumption was so high from 1998 onward, the reason is a combination of having children of teenage years in the house combined with having elderly parents from 2003 onwards. One elderly parent is still with us in 2016.  Without her, the Powerspout years 2014, 2015 and 2016 would show even less grid consumption).

The hidden advantage of a small turbine is that its output is so small that all of it, or virtually all of it, gets to be used 'in-house'.  The same cannot be said of a larger turbine because a normal house would struggle to consume the continuous higher level of power output it can put out. So all of the small turbine's output earns a return twice over: once from the feed-in-tariff payments and again from offset of grid energy. Only a small proportion of a larger turbine's output earns 'twice over' in this way.
    
So whilst the financial benefit from feed-in-tariff income might be small for a Powerspout, the financial benefit from 'offset' grid energy is significant: as the bill above relates, this quarter has cost £71.72; the bill for a first quarter in a typical pre-Powerspout year such as 2013 (when electricity prices were very slightly cheaper) was £261.14, giving an offset value for this quarter of £190 (calc: 261- 71).

Factor in the much higher installation cost for a big turbine, which can be approximated at being £7,000 - £10,000 per installed kW, and the maths for a small turbine become even more attractive.

How significant is the contribution from a Powerspout then ? - I would say very.

Added later: for the sake of completeness, the Powerspout's generation for the same quarter was 1,697 kWh.  If all of this was used in-house, total consumption for the quarter was 2,075 kWh (calc: 1,697 + 378). The gain from offset was therefore greater than as calculated above, which used consumption in 2013 when the total was 1,736 kWh.

Wednesday, 27 January 2016

Update on output & more on temperature effect

Just a couple of light weight matters to post in this diary entry.  I call them light weight to mark them as more easy to follow than the heavy weight stuff discussed in the last entry and in the "Thoughts about Inverters" entry further back.  
Much useful discussion resulted from those posts, only some of it in the comments section after them. I'm still working to understand it all and perhaps will post about it if I can get my newly found understanding into an intelligible form. The comment which encouraged me most (which was not published), came from someone who really understands motors and generators when he said, after giving as lucid an account as anyone could give: "I hope this makes some sense, there are few explanations that make any reasonable attempt to explain what is really happening in an alternator as you load it", - my thoughts entirely.

So the light weight matters are:

1. Generation so far this year.
It has been extraordinarily wet here in Wales, (UK) and the Powerspout has had an uninterrupted spell at full power since 1st Dec.  This, together with it generating 30 watts more for the same flow than in previous years, has seen the record of energy generated outstrip previous years; long may it continue!


2. Confirmation of temperature effect on generation.
Early in January we had a brief period of cold weather.  Night time temperature dropped to below freezing for a few nights making the temperature inside the SmartDrive housing 19.4 deg C. Compared to the normal operating temperature of about 26-29 deg C, it was thus some 7 to 10 degrees cooler than usual.  As the records of power output below show, power increased by 15 watts when it was colder, confirming my earlier observation.


Both these records were with a de-finned rotor.  The aim of de-finning was to reduce energy lost to the extra work of revolving a finned rotor. But de-finning necessarily reduces ventilation and thereby raises temperature.  Since raising the temperature clearly reduces power, it has to be wondered whether de-finning gains anything at all.  When I looked at this a while back, the gain from de-finning was only 1 to 2 watts but no consideration was given in that study to holding temperature constant. 

So there's another research project in the making !