6.48 mm diameter nozzle delivering 0.91 l/s to the runner which is rotating at 1084 rpm and generating 225 watts into the grid at an overall efficiency of 47%.
Showing posts with label Operation. Show all posts

Monday, 12 July 2021

My chart for optimum Powerspout operation.

Powerspout owner / operators who rely on a water source that is seasonal will be familiar with the challenge of needing to optimise the output of the turbine when using different sized nozzles for the different seasons.

In this blog, I'm posting the chart I use to help me with this challenge.


For me, the variables are the type of rotor, the amount of rotor packing, and the type of stator. 

When flows are good and a big nozzle is in use, so much torque is produced by the jet hitting the pelton that the more highly magnetised Type 2 + rotor is needed to keep turbine speed down to a speed where maximum power is produced.

At the other extreme, when flows are least and there is a small nozzle, the torque lost in overcoming the attraction between the rotating magnets and the iron cores of the stator is such a large proportion of the total torque being produced by the pelton that the number of poles in the stator has to be reduced from 42 to 18 in order to keep shaft speed up.

Between these two extremes, the chart gives me a system, which I've built up from experience over 8 years, to guide as to when to change from one type of rotor or stator to the other, and as to how much packing to place beneath the rotor for each of the 13 nozzles I employ.

The chart also has a column for efficiency, and this is 'whole system' or 'water-to-wire' efficiency. Numerous factors contribute to this figure, and these include: how good the penstock is; how good is the alignment of the jet on the splitter ridges of the pelton cups; how well cut are the nozzles to give a good jet profile; how much drag effect there is from grease in the bearing housing; how much transmission loss there is between turbine and inverter, (this will vary with the current); how good the efficiency of the inverter is at different input voltages; and how inefficient the Smart Drive alternator becomes by packing off the rotor. 

Peak efficiency can be seen to be 56.8% and this is achieved with nozzle XII, delivering 2.43 l/s at 1102 rpm, generating 723 watts leaving the inverter.

As I write this, the nozzle in use is number VII and the Powerspout is producing 321 watts; for this time of year this is exceptionally good and is a reflection of the rather wet summer we are having so far; unlike most people, I'd quite like it to continue that way !

Saturday, 15 May 2021

On holiday but in touch.


I've just been away on holiday, - and owners of Powerspout turbines have decisions to make when they go away.

Those lucky enough to have a water supply which is constant can decide without thinking: - the turbine can be left running. But for those, like me, who have to change nozzles, planning is needed.

One option would be to shut down the turbine, but that would mean missing out on useful generation; an empty house still uses electricity and it's nice to know the hydro is meeting that demand.  Besides, I've set myself the target of generating all through each year without any breaks, and that means I don't come close to considering shutting down.

The alternative then is to keep going, and this is where it gets tricky; my crystal ball has to be dug out so I can gaze into the future to make a prediction about how much water is going to be available while I'm away.

The reason for this is that Powerspouts have nozzles with an orifice size which is fixed, and they are not automated in any way; many small hydros are automated; they have a nozzle orifice which is variable in size and can be adjusted dependent on how much flow is available, the flow being sensed by the level of water in a tank at the top of the penstock.

People can, and do, automate their Powerspouts along this line but keeping things simple is the line I prefer to take.

So the exercise with the crystal ball is to discern what size of fixed nozzle to leave the turbine with, which will still, I hope, be the right size for whatever is the flow at the end of my time away.

The things to look for in the crystal ball are recent rainfall, time of year, anticipated rainfall, temperature, and vegetation cover in the catchment area of the water source.

It doesn't much matter if you compute everything and get it wrong; if the flow dries up more than you thought it would, it's not a disaster.

What happens in my set-up is the head tank empties, water coming into it immediately goes out again down the penstock, setting up a new operating head somewhere down the pipe. This lower level of head ensures flow through the nozzle is less and the end result is a new equilibrium is reached where water arriving equals water leaving.

The operating efficiency of the system is rubbish when the turbine runs like this, - it labours at a much too slow rpm and power output is greatly reduced, - but the system does manage to keep generating and no damage is done.

Because of the technological wonders of the age we live in, there is no need to be in ignorance of how your turbine is doing while you're away. The photo shows that at the top of Carn Llidi in West Wales, I could check to see if the crystal ball had spoken truthfully.

In fact, when I got home I discovered it had not; far from drying up, 5 inches of rain had fallen in the ten days I was away; I could have been generating twice as much as the 220 W I set the turbine up for.

I need to get a new crystal ball !


Sunday, 15 July 2018

The latest picture

It's proving to be a hot summer.  No rain for over a month and I'm down to my next to smallest size of jet. But unlike many small hydros at least mine is still generating.  The number of kWh it manages in a 24 hour period is not many (3 in fact), - but solar panels make the generation total 17 - 24 kWh / day.

Here's what things look like as of today:

At the top end:


At the business end:


At the consumption end:


At these low flows, the usual 42 pole stator is replaced by a reduced stator having only 18 poles.  Without this there is too much magnetic attraction between the permanent magnets of the rotor and the steel core of the poles for the pelton to get up to speed.  Here is what the reduced core stator looks like:


Friday, 8 June 2018

The picture now ...

It's June and water flow is drying up.  For comparison with the pics posted in March, these pics show how the set up is running this morning:

1. View at the top end


2. View at the business end


3. View at the consumption end

Saturday, 10 March 2018

Pictured today...

1. View at the top end
2. View (and sound) at the business end


3. View at the consumption end

Wednesday, 23 November 2016

Bringing order to nozzle changing

The heavens have opened at last !  From the middle of August until last week it has been very dry here with the water available for my Powerspout being less than 0.6 litre/sec; but a deep depression coming in from the Atlantic last week brought copious rain and has abruptly increased flow fourfold.

Although I have been looking forward to the winter rain coming, its suddenness has caught me on the back foot: in order to generate at all on a flow of 0.6 l/s, the SmartDrive had been set up with 18 pole stator and the rotor packed off maximally.  All this had to be changed and changed in the middle of a downpour: the 18 pole stator replaced with a 42 pole, the packing reduced and nozzles upped to match the greater flow available.

Despite my best efforts to have an orderly "take off" into each new water year when the rain comes, I have to admit I've failed this year.  I like to increase the nozzles in a steadily incremental way which matches as closely as possible the increasing flow. I don't like having to 'back track' to a smaller nozzle because I've put in too big a one. But a big element of getting things right is predicting how quickly the flow is going to increase and this year I've got it wrong; I've been beguiled by the torrent of water in the stream into which the turbine discharges (see pic below), and twice have put in too big a nozzle only to have to replace it with a smaller one within 24 hours.  I've been slow to follow my own adage that a source coming from a spring increases its output only gradually as ground water builds up; that I must not be misled by the early 'flashiness' of the run-off which appears in the stream.


In an attempt to bring a system to nozzle changing, I try to bring in a bit of measurement so the process becomes less of a guessing game.

For each nozzle I like to think I know what discharge the orifice will give; but in reality I know the accuracy of the figure will probably not be very good.  The lack of accuracy arises because the way of calculating the discharge involves a formula and that formula has rather too many inputs which are not known with great precision; the formula is:


Q  = CD x Anoz x √ (2g x Hn)
where: 
Q is the flow from the nozzle (m³/s)
CD is the discharge coefficient for the nozzle (dimensionless; I take its value to be 0.91)
Anoz is the cross sectional area of the orifice (m²)
Hn is the net head (m)
g is 9.81m/s2


The term which is easiest to tie down in this formula is Anoz. By using the taper gauge that EcoInnovation supply in their tool kit, or a 'small hole gauge' and a vernier calliper (see here), the diameter of an orifice can be fairly accurately measured, and from that the area calculated. 

The difficulty comes with the other two terms: CD and Hn; as the orifice size changes so will the values of these two terms; but it is too complicated to try to measure them for every size of orifice; it is easier to assume constant values and recognise this will introduce an inaccuracy to the value calculated for Q.

With this limitation in accuracy admitted, my orifices are so arranged as to have a difference in flow between one and the next of about 0.3 l/s.  The smallest orifice, Roman numeral # 1, is cut to deliver 0.3 l/s.  By keeping this nozzle permanently in the top nozzle position and bringing it into use only when there appears to be sufficient water to be able to use it, I can test whether the time has come to increase the bottom nozzle by another 0.3 l/s increment: - if I find that employing # 1 causes the header tank to stop overflowing, the time to up the bottom nozzle has not yet come; but if the header tank still overflows, I can up-size the bottom nozzle.


Intuition might say that employing nozzles of markedly different size in the top and bottom positions is a bad thing.  True, it will produce a vector thrust which has to be born by the bearing on which the shaft is carried; a vector thrust which is cancelled by an equal and opposite force if the two jets are equal in size.  But the size of this thrust when calculated at the bearing is small and is unlikely to be a factor in limiting its life. 

The more important consideration relates to the velocity of the water in the two jets; it may be counter-intuitive, but the velocity is actually the same.  This comes about because jet velocity relates only to net Head, not to orifice size.  So the two jets actually deliver water to the pelton cups at the same velocity even though one is delivering more mass of water than the other.  Having the same velocity, the relative velocity of each jet to the speed of the runner is the same for both jets and this is what is important for good pelton efficiency.


As I finish writing, it has not rained for over 24 hours; all today I've been running on nozzles # 1 and # VIII delivering respectively 0.3 and 1.6 l/s, and giving 448w into the grid; the header tank is still overflowing and the forecast is for no more rain for several days.  With that forecast, the likelihood is my next move will be to turn off # 1.

It's good to have a plan but better still would be to have more rain !

Saturday, 19 December 2015

The system at full stretch

Minimal script in this post to counterbalance the wordiness of the last two,-  just pictures taken this morning of the system working at full capacity:
Gathering the flow

Removing the trash

2.84 lps bottom jet, 0.3 top jet; 1200 rpm

Spent water returning to the stream

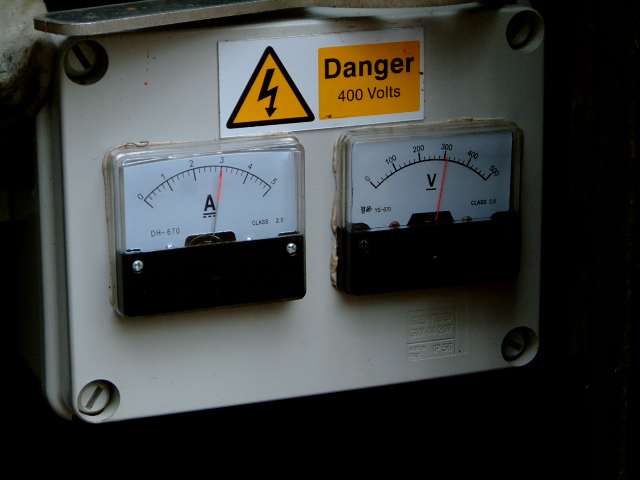
3 amps;  305 v dc

Relative humidity 33%, temp 26.8 ℃ (ambient 95%, 14℃)

Working in turbine mode

302 v ± 3  - very steady cf MPPT mode

Wattson: my in-house visibility of output

Sunny Beam: my in-house visibility of cumulative energy

Wattson Anywhere: my on-line visibility of power and energy output, captured the following day


The really accurate figure for energy output for this one day was 18.78 kWh, giving a mean power output of 782.6 watts.  The Wattson and SMA data seen above are not so accurate. The whole system efficiency for the day can therefore be calculated to be 47~ 48% (782.6 / [53.6 x 3.14 x 9.81] ), the inverter efficiency to be 85 ~ 86%, and the pelton/alternator conversion efficiency to be 55 ~ 56% ( [3 x 302] / [53.0 x 3.14 x 9.81] ).

With the whole system efficiency coming in at 47~48%, there doesn't look to be a significant improvement over last year (see here) when I was running in MPPT mode and two equal sized jets.  So maybe turbine mode and having most water coming through one big bottom jet doesn't confer any advantage.

Thursday, 15 January 2015

To the limit, ... and beyond.

The 'hours total' recorded on my Sunny Boy inverter is now 8,238 hours, which means it has been receiving power from the turbine for 12 days short of a year.  In that time, it has never managed to put out the 750 W which calculation said should have been possible with a flow of 3 lps.  Today's post is to say the 750 W limit has finally been reached and exceeded.

A flow of 3 lps generated 748 W, - ever so close to the target output, but nevertheless falling short and leaving me hankering to see the full ¾ kW displayed on the Wattson monitor. 

Today, by delivering slightly more water with just a slightly bigger nozzle on the top jet (∅ 7.46 vs 7.14 mm), the output is now 765 W.  To the best of my measuring ability, the flow giving this output is 3.12 lps, - so just 4 % more than calculation predicted and possibly within the margin for error anyway.


To obtain this output from the inverter to the grid, the dc input to the inverter from the alternator is as follows:


... near enough 915 W (3 A x 305 v), - a figure qualified by these being cheap meters with limited accuracy.

915 W 'in' and 765 W 'out' means there is a power loss in the inverter of 150 W, - a surprisingly large chunk of power, making it apparently only 83% efficient at this power level.

I can't quite fathom this out for the moment, - it goes against what I have documented in previous posts (see here) that inverter efficiency gets better at higher power levels. Certainly a hand on the inverter to feel its warmth confirms that its grab of 150 W is probably correct.

Perhaps the answer lies in there being a more significant voltage drop over the transmission line at this power level, such that the voltage the inverter sees is not what's displayed on the above meter.  Hmmm - I'll have to sleep on that to work out a way of checking it out. 

I'll sleep more soundly though, knowing the hydro's that little bit more productive. 

Tuesday, 13 January 2015

Rain, glorious rain.

 Yesterday, it rained steadily all day.  

As a general rule, one third of the rain hitting the ground runs off immediately into surface water courses, one third soaks down to top up ground water stores, and one third returns to the atmosphere as evaporation, which includes, in summer, transpiration from vegetation.  

Since it is winter, there won't be much evaporation or transpiration, and because the soil on our hillside is made up of geological deposits of sandstone and mudstone which have been weathered down to leave a fairly absorbent soil on the surface, a good proportion of our rainfall seeps down to reach ground water.

This is good news for me as the source for my turbine is a spring. The springs, and there are many of them on the hill, all occur on particular contours along the hillside because of thin beds of limestone sandwiched between the sandstone/mudstone deposits. These 'limestone developments' create the springs by allowing the groundwater back onto the surface. What is interesting is the time it takes between the rain falling and the springs gushing.

Yesterday evening, after the day's steady rain, the yield of my spring had not picked up very much at all.  But by this morning it was beginning to show an increased flow, and, because the ground acts as a reservoir giving up its rain-replenished water slowly, this increased flow should continue to gush for some time to come.

In anticipation of this imminent increase in flow, I changed the Powerspout's nozzles this morning to a combination which will give just short of maximum power output: lower nozzle delivering 1.6 lps, the upper 1.18 lps, together giving 718 watts out of the inverter to the grid.

It's always a bit of a guessing game deciding how much 'spare' flow there is, and just which nozzles can be put in.  It's even more of a gamble when you're trying to guess in advance of the spring actually giving up its water: choose too big and the header tank drains down; choose too small and you chide yourself that you're not maximising generating capacity.

This morning I seem to have got it right.  After putting in my chosen nozzle combination, there was still water in excess overflowing the tank and running down to join the stream. That stream will take it to the River Usk and thus it will return to the sea whence it came in the first place.

Conveniently, I can visualise how much 'spare' water I have available at any time: in its drop to join the stream, water from the spring, which has not been diverted to the turbine, falls over the rock face of a quarry at the bottom of the hill.  By the trajectory of the spout from the pipe, I have educated myself as to what volume of flow there is.

Here are before and after photos of that flow, the difference between them being 0.22 lps, the extra volume diverted to the turbine by putting in a bigger jet this morning:


OK, there isn't much difference  - but to the educated eye, there is !  I had hoped for a more depleted flow in the 'after' photo to make the point, but it wasn't to be.

So today, 13th January, I have almost reached peak power output.  Last year this point was reached on 7th January and it then continued un-interruptedly for 75 days until 23 March, contributing 1.28 MWh of last year's total energy output of 3.67 MWh.

I wonder how this year will turn out in comparison.


Wednesday, 3 December 2014

Testing the system.

I've always wanted to know what would happen to the turbine and its electrical output if the header tank were to drain down to empty. A few days ago I had the opportunity to find out.

After the wetness of mid November, things have turned dry again, so I was in the situation of still having the largest nozzles in the turbine, delivering the design flow of 3 lps, with a supply of water which was slowly diminishing.

Inevitably, a time came when water inflow to the tank fell below outflow down the penstock to the turbine, and instead of overflowing, as is the normal operating condition, the tank gradually began to empty.

The dimensions of the tank are 2.74 x 1.52 x 1.37 metres but since the bottom 83mm cannot be accessed, the useable volume is 5.3 m³.  With this generous volume of reserve, and only a small difference between inflow and outflow rates, it actually takes several hours, more than 12 on this occasion, for the tank to drain down. Somewhat inconveniently this meant all the action was set to happen after dark.

Here is an aerial picture (actually taken from up a tree) of the header tank and the arrangement for gathering water into it:


And here is the record of power output from the inverter into the grid over the period when the tank was emptying.  The record was captured using Wattson power monitoring and the data downloaded to my computer using the Holmes software that Energeno provide free for this purpose:


What did I learn from it all ?  The most useful lesson was that the system is resilient to such an event: nothing occurred which could foreseeably damage the key components of the system, namely: turbine, pma alternator and inverter.

If anything, the system 'fails safely' because the dc voltage falls to a lower operating level than normal (in this event it was 265 v dc at its lowest) because with the lower 'head' created in the penstock, turbine rpm will have decreased marginally.  Against this effect, there will have been a counter tendency to raise voltage created by the inverter lowering the load it places on the pma.  That the overall result was a drop was interesting.  It was not obvious by observation and listening that the turbine rpm was very different from usual.

So, all in all, an exercise which was worth doing even if it did give me a sleepless night !

Monday, 27 October 2014

One jet or two ?

In their literature, EcoInnovation recommend that Powerspout peltons are not operated on one jet if the power output from the Smart Drive exceeds 400 W.  This is presumably because of mechanical stresses on the root of each runner cup.

For a GE 400, (or the later Powerspouts which are directly grid connected using an Enasolar inverter, without the V-clamp board which is found in the GE 400), 400 W DC output from the Smart Drive equates to about 330 - 350 W AC from the inverter to the grid. The actual figure will be dependent on transmission losses and inverter efficiency at this power level.

The plot below is taken from the literature of a long established UK manufacturer of water turbines based in the Lake District and shows how, for their turbines, there is an efficiency benefit to be gained from delivering the flow via two jets rather than one when the flow is toward the low end of design flow.


Assuming what is true for their twin jet peltons is also true for a Powerspout  and applying the information from this plot to my installation, it would mean that at 40% of full flow (1.2 lps / 3 lps) I would gain 3 % in efficiency.  In power terms this equates to seeing 250 W rather than 243 W into the grid.

So the message would seem to be: at those levels of flow where EcoInnovation say it is OK to run on one jet, it is actually more productive to still operate with two.
Correction added 28 May 2015: this is an erroneous conclusion. Please refer to later addendum "One jet or two - the bigger picture"

I have to admit though, - I haven't tested this experimentally.  It would be very difficult to cut 3 nozzles sufficiently accurately to ensure that the sum of the flow of two of them was exactly equal to the flow of the third.

In the next post: since the above plot shows that a pelton remains reasonably efficient down to a part flow of 20%, why can't I operate mine below a part flow of 40% ?

Friday, 17 October 2014

Accurate to two decimal places.

What I like about operating my Powerspout is both the unpredictable element, namely the dependance on the vagaries of rainfall, yet the very precise predictability of how much power will be generated for a given flow.

So I have taken to operating my installation rather like a laboratory experiment.  I measure, record and calculate various inputs and outputs which enable me to better understand the quite complicated engineering which underlies such an apparently simple machine.
  
Most especially what this admittedly 'anorak-like' approach shows is how losses, or inefficiencies, in the system drastically reduce the electrical output.  I want to draw attention and explain this further in the next posts on this blog.

To make any kind of scientific investigation, I have had to decide just how accurate I intend to be, and an accuracy of two decimal places is the tolerance I aim for in most readings.  This should mean the conclusions drawn are reasonably valid.

To measure available flow, I divert water from going into the header tank and measure with a stop-watch the time it takes to fill a coal scuttle (11.36 litres).


Today, it was 20 seconds, the same as yesterday, making the flow 0.57 lps.  Still not enough to run the turbine continuously without draining down the header tank.  The premise on which my scheme works is that outflow from the tank cannot exceed inflow if the turbine is to operate continuously. The corollary of this is that the tank must always be at least slightly overflowing.

The out flow from the tank to the turbine is determined by the size of the two nozzles jetting water onto the pelton wheel.  The out flow can't readily be measured but it can be calculated. The formula is: 
Q = CD × Anoz × √[2g × Hn] 
where Q is flow, CD the discharge coefficient for the nozzle, Anoz the cross sectional area of the nozzle hole, g is acceleration due to gravity and Hn  is the net head of the scheme.  

So three unknowns: Hn, Anoz and CD have to be discovered.  Here's how I have measured each:


  1. Net Head


2. Nozzle area


3. Discharge coefficient
Powerspouts are provided with well designed, 40° tapered nozzles having a discharge coefficient (CD) of 0.89-0.91.  I established this value one afternoon by using the same equation above, but this time in-putting the flow as a known. I had somewhat laboriously measured it by measuring the turbine discharge flow. (note added 6 Feb 2018: the Cd was later measured to be 0.85 not the figure given here; see this diary entry).

Solving the equation for the two nozzles fitted in the turbine at the moment, I know that the outflow will be the sum of 0.83 and 0.30 lps, ie 1.13 lps.
Since this is twice what the inflow is, it is clear continuous operation of the turbine is still not possible.
Patience is needed, but the good news is that the weather forecast is for a warm, wet week ahead.