6.48 mm diameter nozzle delivering 0.91 l/s to the runner which is rotating at 1084 rpm and generating 225 watts into the grid at an overall efficiency of 47%.

Monday 11 December 2023

Battery storage completed.

In previous blog posts on battery storage, I waded through the deliberations that burdened me as I struggled to reach a decision about proceeding with it; in this post, I just want to show what actually came of it all.

In a future post, I’ll look at the system's pros and cons, but I'll write that when more time has passed with it being operational. At present, it has only been operational for 6 weeks. In that time our energy consumption from the national grid has been less than 5 kWh (before it was 200 kWh for the same 6 week period in previous years), - so early impressions are favourable.

Location for 'battery bunker' BEFORE construction

Battery bunker AFTER completion

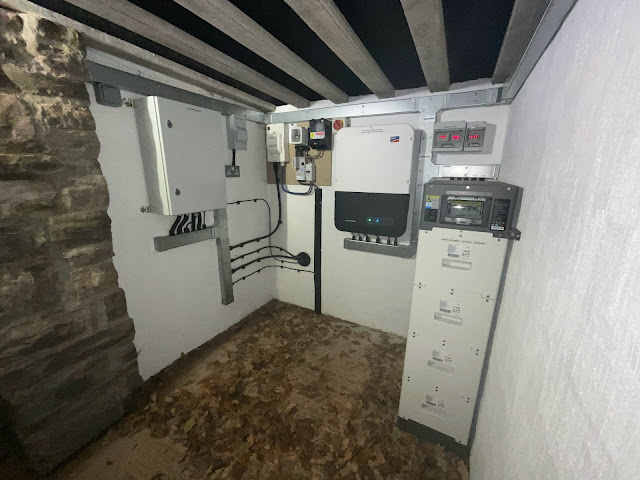
Inside the bunker

Meters for ac frequency and volts, and battery dc volts; the switch is the 'black start switch' for manual operation of battery back-up

BYD HVS battery tower, 4 battery modules totalling 10.24 kWh, with Battery management Unit on top

SMA Sunny Boy Storage 3.7-10 inverter with ac ON/OFF switch

Connection compartment at bottom of SMA inverter; additional devices on the right are a DIN rail mounted, 5 way, Ethernet switch and its 12vdc power supply

Cable entries to underneath of Enwitec Battery Back up box; the Enwitec box accomplishes all the switching arrangements for transfer from grid supply to battery supply when there is a grid outage, and back again to grid when the grid is restored; this it does either automatically or manually; manual control is by means of the "black start switch".

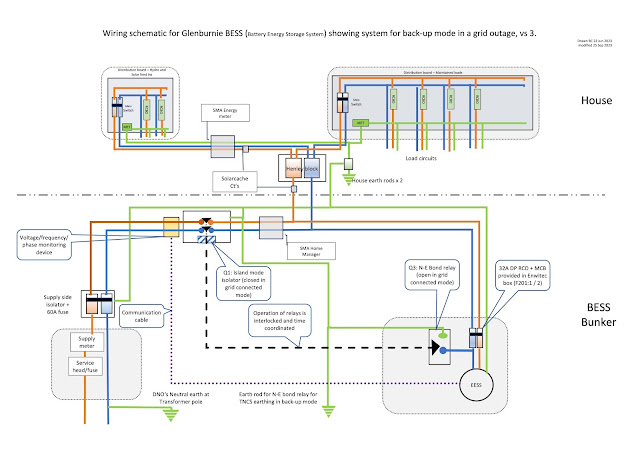
The inside of the Enwitec box; The key component monitoring power flow at the grid connection point is the SMA Home Manager 2; it is the device to which the green Cat 6 (shielded) ethernet cable is plugged into. The contactor Q1 on the left side is the device which isolates the property from the grid when battery backup is in operation. Relay Q3 is the device which ensures grounding of the neutral conductor when in battery backup mode. F1 and F2 are mccb's protecting the power supply to the Enwitec box, one for grid supply and one for battery backup supply; F201:1 and F201:2 are respectively an mcb and a rcd on the ac line connecting to the SMA SBS inverter.

The incoming National grid supply, and its meter, were moved into the bunker from their previous place in an outside receptacle on the wall of the house; this was to make more simple the cabling arrangements for battery back up; the earthing arrangement when on grid supply is TT, and on battery back-up operation it changes to TNCS. 

In the house, two new consumer units were installed, one for house loads and one for in-coming power from the two renewables available:- these are the Powerspout and 3.2 kWp of solar; the total generation from these two renewable sources is measured by an SMA Energy meter; this is the device with a red ethernet cable connected to it; the data from the Energy meter is made available by Ethernet cable connection, via a LAN network, to the SMA Home manager (in the Enwitec box housed in the bunker); also, the data from all devices in the system is made available, via a www connected router, to SMA's web interface; this they call Sunny Portal; next year 2024, for systems which have a Home Manager, SMA will be replacing the classic version of Sunny Portal, with their new web interface called Sunny Portal powered by ennexOS; when that comes, the User interface will have, so they say, a new fresher look.

The user interface provides all the expected features of instantaneous and historical energy flows that one expects from such technology; the parameters and configuration of the SMA SBS inverter can also be accessed directly via the LAN network, and this is essential in setting up the system and for investigating faults when they arise; following SMA's advice, which they strongly encourage, I went for cabled communication throughout, rather than using WiFi.

This is our meter measuring in-coming energy from the national grid; the pencilled readings top and bottom were the readings on the day when the battery storage first started operation, and that was 41 days ago; you can see that in those 41 days only 0.6 kWh of low rate energy has been used, and 3.1 kWh of normal rate; in that time we have cooked, heated our domestic hot water, charged our Nissan Leaf umpteen times, and met all the 'base load' requirements of a normal modern house; as I mentioned at the start, normally this would have taken around 200 kWh, - so the battery has, thus far, been 'transformative' !

For the really technically minded enthusiast, here are the schematics for the scheme as it was finally constructed:


Sunday 1 October 2023

Year end results for 2022-23 water year

Each year, I put out these graphs of yearly generation because they are compiled from real data and tell how a small hydro actually performs. People who are still at the planning stage of a turbine installation are faced with having to make a number of guesstimates, and the biggest is whether their turbine, in the location they have for it, is going to be productive enough to make it worthwhile. By making known how my turbine performs, and drawing attention to the seasonal and yearly variations in performance that there are, I hope it helps others in the planning stages to fine tune their guesses to arrive at a reliable estimate of the worthwhileness of their project.

In each graph, the bold black line is data from the 'water year' that has just finished, ie: 1st October 2022 to September 30th 2023.

1. Daily energy and power output

Although Wales is known for its rain, rainfall in winter always comes in spells; this year was a 3 peak year, with spells in November, January and March / April,

2. Cumulative energy (kWh)

With 4,385 kWh generated, it was not the most productive year but certainly better than most.

3. Power duration curve

The pattern for the year follows the pattern for other years; note that at the 365 day point, generation was still 100 watts, and that indicates the turbine ran throughout the year with no shutdowns for lack of water.

4. Rainfall vs energy generated for the past 10 years


The graph shows how generation and rainfall follow each other intimately.

Concluding thought:

The graph which relates rainfall to energy generation shows how productivity ultimately comes down to how much it rains; but if we delve a bit deeper, we can extrapolate back further than mere rainfall; - the electrical energy we extract from a hydro is only the same energy in another form that originated from the sun, - caused water to evaporate from the ocean, - rose as water vapour into the sky, - and fell as rain onto ground which happened to be higher than the ground where a turbine is sited. So simple ! The sun is the ultimate source, - just as it is for every other energy source we use, - except nuclear and tidal.

Tuesday 29 August 2023

53,760 hours.

 53,670 hours is the number of hours in just over 6 years, and this week I decided after this length of time it was time for the bearings to be changed; this blog illustrates what everything looked like when I took the bearing-housing apart having never disturbed it in all that time.

I installed the bearings on 5th July 2017 and they were SKF E2 Energy Efficient bearings; they have run continuously ever since bar one period of 48 hours in October 2018 when there was insufficient water; the only other times when the turbine shaft has not been turning is when a nozzle is changed, or the stator is changed, and such stoppages are typically for only a matter of minutes.

Of particular note is that the bearings have not been greased at all; neither was grease preloaded into the bearing housing when they were first installed; they have operated only on the grease put in by SKF at manufacture.

I made the decision to change them only because 6 years seemed a long enough interval; there were no warning signs of impending failure that prompted the change; literature from SKF suggests that the bearings can be expected to be serviceable for up to 9 years; after this length of time the grease will have come to the end of its ability to lubricate and 10% of a batch of apparently identical bearings will fail; this metric for predicting the likelihood of a bearing failing is called the T10 life expectancy; it is very much dependent on the conditions under which the bearing is operating, especially the load it is carrying, the temperature it is operating at, and most especially whether water and other contaminants can get to the rolling parts.

6 years is thus within the T10 life expectancy for the bearings - except the big unknown is the conditions under which they are actually operating.

So here is a pictorial account with captions of what the seals and bearings looked like: -

on my turbine, I have a specially made cover to help prevent water ingress; its purpose is to give a metallic face for the V-lip seal to rub on; it fits over the plastic 'Top-hat' and is held in place only by being a tight fit. 

a puller was needed to get it off.

another modification I have made on my turbine is this deflector to discourage water from entering the drainage hole of the 'Top-hat'

the first glimpse of the condition of the shaft indicated that little moisture was getting to it


for comparison, this is a picture from the previous bearing replacement in 2017, which was done after just 14,448 hours of operation and before steps were taken to prevent water ingress; it shows limescale encrusting the shaft, indicating that quite a bit of water was getting in.

detail of, and explanation of, the marks on the shaft; the brown colouring was of silt-like consistency and rubbed off very easily with wire wool; the surface of the shaft was not scored where it had been polished by the seal.

I was surprised by how much the stainless steel of the cap had been worn by the rubbing of the V-lip seal; it was almost as bad as the wear on the plastic of the Top-hat in the next picture, except that the plastic wore to be like this in a matter of months.


when I had removed the dust shields of the two bearings, the grease around the balls still looked pretty good


a close-up of the balls shows they were still well lubricated

SKF's E2 bearings have a very different looking ball cage; this is what the reverse side looks like.


the radial shaft seal on the inner end of the Top hat was a bit mucky; it has two lips and the second picture is a close up of the space between the two lips showing it to be full of the silt like material present on the shaft.

In summary, the bearings looked good enough to do another few years, but the seals were in need of being changed. The feel of the shaft rotating in the housing was of very free rotation as if the bearings were well 'run-in'. By comparison, when I had put in new bearings, of the same sort, the rotation felt rather stiff and not so free.

Unsurprising then that when I powered up the turbine with its new seals and bearings, power output was 16 watts down on what it had been, - that's a 4% loss of efficiency, - down from 44% to 40%, taking efficiency here to mean whole system efficiency, ie water-to-wire.

Ah well, - better a small drop in generation now than having the bearings fail later, - possibly in winter and having to do the job of changing them on a cold, wet day, as an urgent rather than an elective undertaking !

Monday 19 June 2023

A lesson learned

Even after 10 years, I am still learning about my Powerspout; today the lesson has been how minutely critical the alignment of the jet to the pelton wheel needs to be for maximum power to be generated.

My lesson came about like this: the turbine had been running very sweetly on 1.23 l/s, generating 331 watts into the grid, at a water to wire efficiency of 51.2%, - when I took it upon myself to disturb this happy state of affairs by putting in a wire-mesh grill; the grill was to sit beneath the turbine and stop me dropping parts beyond reach of retrieval when I do a nozzle change.

To slip the grill into place required the plinth on which my turbine sits to be lifted a very small distance, - but to lift the plinth requires the pipe manifold to be separated from the Powerspout casing, and to do that, the jet-cum-nozzle assemblies have to be removed.

No problem I thought !

After re-assembly, I was perplexed to find that the previous output of 331 W was now only 250 W, and the overall efficiency had dropped to 41.2%.

Nor did the turbine look or sound right; the splash pattern was not what it had been and there was the sound of some water missing the pelton and hitting the opposite wall of the Powerspout casing.

What followed was much experimentation with packing washers behind the runner, measurements using my knitting needle alignment tool (see this blog) and checking and rechecking what else could have been inadvertently put out of alignment.

Eventually, it was a hammer and a piece of wood that solved the issue, - by judicious tapping of the jet-cum-nozzle assembly whilst the turbine was running.

The tapping restored the original happy state of affairs by moving the assembly tiny amounts within the bounds of the hole in the casing through which the assembly passes, with these barely perceptible movements being judged good or bad only from observation of the splash pattern and from the sound the turbine was making.

Creating a Powerspout installation is a labour of love; having created it, everyone wants 'their baby' to generate as much as their site conditions allow; as this lesson teaches, it's worth checking that your jet alignment really is optimal.

Here are some pics to put flesh on the day's adventure:

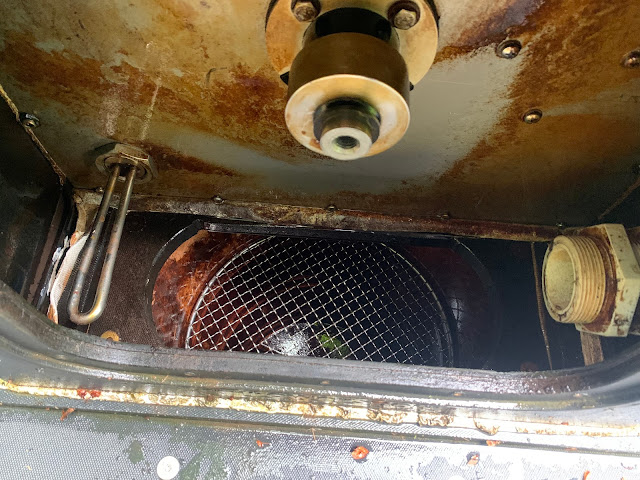
Wire mesh grill in place beneath where pelton runner normally is attached to the shaft.

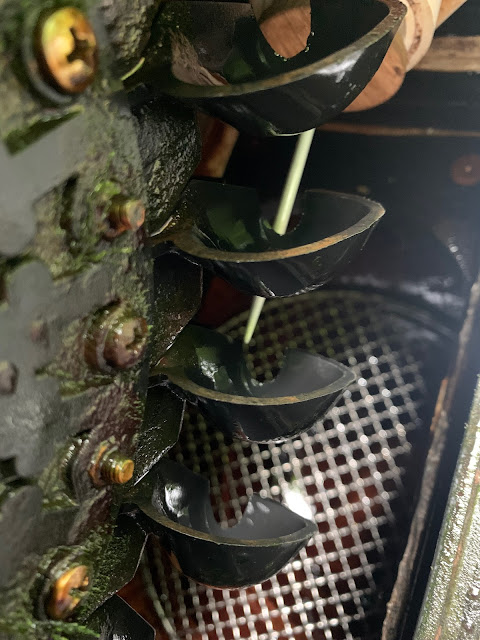
Using knitting needle tool to optimise alignment of runner to centre of jet.


 "if all else fails, 'it it wi' 'ammer" !

Monday 12 June 2023

Optimising my inverter turbine curve

 The inverter that connects my Powerspout to the grid does more than just convert DC power to AC; by the load it imposes on the alternator, it determines the speed at which the shaft turns, and the speed at which the shaft turns is critical if a pelton is going to extract the maximum power from the head and flow of water available.

I run my inverter in what is called 'turbine mode'**; run like this, the load the inverter imposes on the alternator is determined from a 'mathematical table' stored in memory in the inverter, that tells the inverter how much load to apply depending on what DC voltage it is receiving from the alternator.

The 'table' is really an equation relating DC input voltage to AC output watts, and whilst a new inverter is delivered with a table chosen by the manufacturer, the table can be changed by the user.

A user might want to change the table because the factory parameters may not suit the performance characteristics of his hydro site, in particular the inverter may not allow the pelton to rotate at its optimum speed; the table in the inverter will work with the factory settings but it will almost certainly not work to produce the very best efficiency.

In a small hydro installation where power outputs are so small, tweaking efficiency to the best possible is a good idea to get the installation to be as productive as possible, and it has been for this reason I've been playing around with optimising the table in my WindyBoy inverter.

Without going into more detail than is necessary to explain how a table relating DC voltage to AC watts is constructed, some familiarity with Microsoft Excel is required.

The relationship between these two parameters is described by a single equation relating x and y, where x is DC voltage and y is AC watts.

The factory default table uses the equation: y = 0.0001x^3 - 0.0306x^2 + 2.92x - 83.

When this is plotted on a graph with x values chosen to be in the range of the DC voltage produced by my Powerspout, it produces the green curve in the graph:


Last year, I spent time carefully investigating what voltage produced the most watts output, for each of the nozzle sizes I operate my Powerspout with over the course of the year.

As a result of that exercise, I came up with a revised table, giving a revised curve, which is shown by the orange line. You can see it is a flatter curve than the green one and that at low power outputs (100 to 150 Watts) when the DC voltage is around 170 volts, the line starts to curve upwards without ever reaching the x axis.  The effect this had in practice was that at this low level of power output the inverter failed to connect to the grid, - presumably because the look-up table confused the inverter regarding the load it should be applying.

Last year therefore, I could not continue to generate with my smallest nozzle (0.53 litres/s) using the inverter with this table in its memory and I had to swap to another inverter which still had the factory default table.

This year, with summer progressing toward the driest time of year in September / October, I wanted to find a curve which would be able to work at this low flow. Playing around in MS Excel has yielded the blue line in the graph which I hope will do the trick.

You can see it almost overlays the orange line for most of its course, and that is good because it means it will make the inverter operate at the optimal points determined by my investigations last year, and crucially it does not start to curve upwards when power outputs are low.

Time will tell if my playing around has worked. Already in the few weeks I have been using this revised curve, when flows are still around 1.5 litres/s, there is a marginal improvement in power output compared to the orange curve, lifting water to wire efficiency by just one half of a percent! (53.3 to 53.8 %).

Every efficiency gain counts !

Here's a picture of loading the revised formula to the inverter from a laptop, running SMA's WindyBoy set up programme, and using SMA's USB Service Interface cable:


** Most inverters used for Powerspouts are solar PV inverters which are programmed to operate in Maximum Power Point Tracking mode; MPPT works for a hydro; but in this mode the inverter is constantly seeking the maximum power point, which for a water turbine is not changing, and so the output is seen to be constantly fluctuating when it could be a nice straight line.

Tuesday 23 May 2023

New live data link

Note added 22 September 2023
This link has been removed because the Bluetooth data transmission on which it worked interfered with a new battery storage system installed later.

I've added a new link to this blog which takes you to a Live Power and Energy web page displaying the outputs of my hydro AND solar generation, combined in one display. 
Before long, I hope to be able to add battery storage, and this link to SMA's SunnyPortal platform will be able to display battery data too when that becomes available. 
Creating the link has been possible by tracking down a WebBox which was for sale in Australia; the WebBox is an obsolete SMA device, obsolete since 2016, - which works by picking up the Bluetooth communicated data from the two inverters and making it available over the web on SMA's SunnyPortal interface. 
My new WebBox was commissioned on 9th March 2023 and therefore only displays data from after that date.