Covid 19 lockdown is making me experiment with new ways (for me) of using digital media.
Here, filmed in time lapse, is the bottom nozzle being changed for a smaller one because water supply is drying up.
The smaller nozzle also required two spacer washers to be added under the Smart Drive rotor - but filming of that didn't work out; maybe I'll try again and add it later .
Enjoy !
...next day:
it turned out that two washers generated fewer watts than one washer so today I removed one; here is the video in real time:
you'll see that:
- the rpm before removing the washer, when the turbine was connected to the grid, was 1152
- the rpm after removal was 1218, but this was before the inverter had established connection to the grid
- when the inverter established grid connection, rpm came down to 1058
The effect of this exercise is seen in the record below of output to grid: power output rose from 443 W to 468 W.
And this means that overall efficiency is better at 1058 rpm and one washer (53.6%) than at 1152 rpm and two washers (50.9%).
A nice demo of how fine tuning can gain a few watts.
All things, both good and bad, come to an end. This week, as the world still battles the flu pandemic, my Powerspout has ended its unprecedented good run of generating at full power: 156 days continuously at between 900 and 928 watts. That's 3.4 mega watt hours of energy, - more than it usually generates in a whole year.
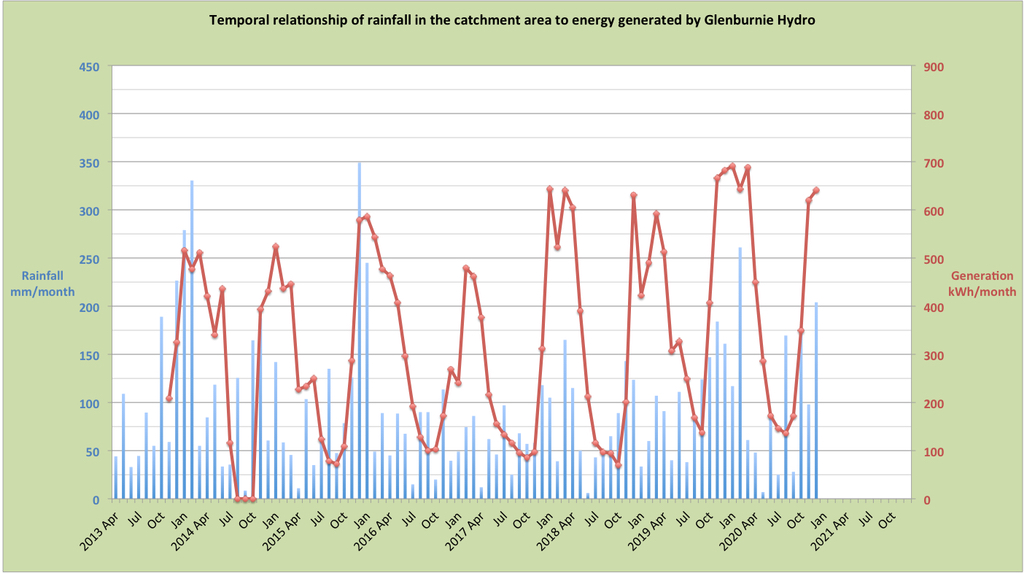
The reason for this bonanza was the exceptional winter rainfall, which as well as bringing generating power also brought us floods. Starting early in October and peaking in February, the rainfall on the hillside where I live comfortably exceeded the long term average until March, as the graph below shows.
I have written before about wanting to understand the relationship between the amount of rain and the amount of energy the turbine can generate. The matter was what prompted me to start measuring rainfall 3 years ago. The relationship ought to have a quantitative element: more rain leads to more energy, - and ought also to have a temporal element: a relationship in time between rain falling or not falling and generation changing.
I now have enough rain and energy data to show these relationships in a graph: (note added 10 Jan 2021: the graph has been updated with additional data)
What it seems to show is the quantitative relationship is confirmed: more rain leads to more energy; but with the proviso that since turbine output is limited to 600 - 700 kWh/month, if there is rain in excess of what will generate that number of kWh's, the relationship no longer holds true; rainfall of 125 mm per month seems to be enough to generate maximally.
The temporal relationship is also evident: in autumn several months of rain needs to fall before turbine output picks up: generation can be said to lag behind rainfall; after a dry summer (e.g. June 2018) this can especially be seen and is doubtless due to ground water being much depleted and needing topping up before the spring, on which my turbine depends, begins to have a good flow.
There is a corresponding mismatch at the start of each year but here generation exceeds what might be expected from rainfall, i.e. turbine output persist for longer than expected; this is understandable as being because the spring continues to flow strongly from ground water accumulated over preceding winter months. Such 'bonus' generation tends to get terminated rather abruptly in April when trees start coming into leaf, so making their own demands on groundwater for transpiration.
Graphs are a useful way of understanding data and we are all being given an education in the use of graphs by the present flu pandemic. When I write again, life will probably be returning to normal from the point of view of flu, though it will be later than that when turbine output returns to the good levels of the past 156 days.