6.48 mm diameter nozzle delivering 0.91 l/s to the runner which is rotating at 1084 rpm and generating 225 watts into the grid at an overall efficiency of 47%.

Monday, 12 October 2015

The usefulness of a Power duration curve.

Even a small hydro installation has a nightmarish cost. Making the decision to proceed with a project can mean having sleepless nights weighing up if the installation is likely to yield a reasonable return on investment. The key word here is  likely. Unfortunately being sure what an installation will yield is something of a black art which needs good data.

In this post, I want to give some data collected over the first two operating years of my project which help in thinking about how productive a hydro is.  It is data which, had it been available before committing, - an impossibility of course!, - would have been very useful in deciding whether to proceed or not.  Yet even without being able to have this 'hindsight beforehand', I hope that for someone who is still considering their scheme, looking at things in this way might stimulate thought about how viable their planned installation might actually be.

The data is presented in the form of a graph which combines in one curve the flow characteristics of my source and the practical challenge of making the most of that flow through timely nozzle changes. It has to be remembered that with a Powerspout you have to work at matching nozzles to the changing flow, and how good you are at doing that is reflected in the productivity of the installation.

The type of graph is technically called a cumulative frequency curve. It shows the percent of time that specified levels of power output were equaled or exceeded during two successive "Water years", each running from 1st October to 30th September.  Such curves are called Power-duration or Power-exceedance curves. Here it is:


What is immediately evident is that the two years are not the same: year 1 (blue) was wetter, peak power was limited in that year to 711 W, and generation was curtailed by me not being able to generate below 200 W.  Year 2, (red) by contrast, saw maximum generation increased to 750 W and generation was possible all the way down to 95 W*, thus extending the percent of the year when there was an output from 72% to 90%.


Despite these improvements, the total output for year 2, which is given by the area under the red curve, was very slightly less than for year 1.  The actual figures were 3,216 vs 3,350 kWh.


The point to note from this is that no single year is necessarily indicative of productivity.  Only several years without any changes to performance will give a true picture.


In general form, the power-duration curve is not dissimilar to another cumulative frequency curve namely the flow duration curve (FDC) for my source.  Clearly the two curves must be related to each other since the yearly pattern of power production must follow the yearly pattern of flow. Here is the FDC for my source, with data collected over 12 months back in 2009/10:
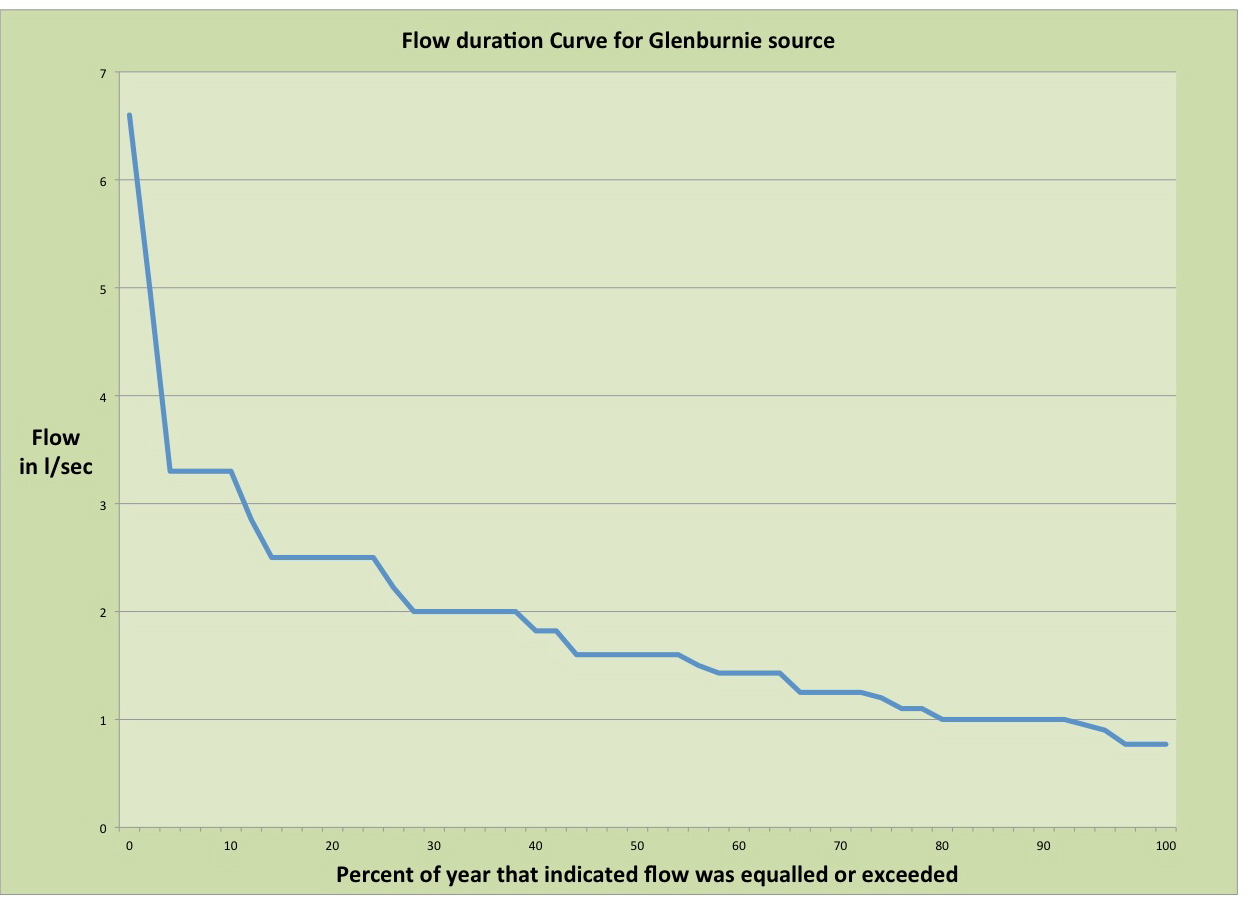


What is not intuitively obvious is that the 'bridging factor' which links the two graphs is the selection of what the 'design flow'** for the turbine should be at this site.


Choosing the design flow is a critical decision and needs to be considered carefully.  A matter which will influence the decision is how capable the turbine is at operating over flows less than the design flow.  As a general rule, opting for a design flow which your FDC indicates will be present for at least 50% of the year is a good starting point but immediately this should make you want to make sure that the measurements for your FDC were taken in a typical year.  There is no way of knowing that to be the case without extending the measurement period over more than a single year and amalgamating the results.  And that all takes a lot of time and effort!


In my case, I went for a design flow of 3 l/sec***. This was a bit ambitious: as the FDC shows, such a flow is only available for a little over 10% of a year and looking at the power duration curves confirms this: full power was only available for 10 % of year 2 and 20% of year 1, (but the latter was a very wet year).


Having opted for a rather high design flow, I then paid the penalty of not being able to keep operating at the lowest end of the flow range, - although by year 2 I had got this sorted by obtaining a reduced core stator for the drier months. And this highlights one of the advantages of the Powerspout system that not getting the design flow right first time can be corrected later by changing the Smart Drive stator.


So, to return to where we started, it is not easy to predict with reliability what the yield, and therefore the return on investment for your scheme will be, but it is possible if you have good flow data, especially if the measurements are gathered over several years.  


Never has it been more truly said "without data, all you have are opinions".  For those bitten by the micro hydro bug this might be re-written "without data, all you have are dreams" !


*    see link for explanation

**  design flow is the flow required for maximum rated output.  For owners claiming UK Feed in Tariff, it therefore determines what you give as your Declared Net Capacity (DNC)
*** this flow at 53 m net head produces 750 W out of the inverter into the grid

Thursday, 10 September 2015

Capping voltage

In the two years my Powerspout has been operational, the only serious issue occurred soon after commissioning in September 2013.  The problem was a failure of the circuit board housed within the Powerspout casing.  Not one but two boards failed in quick succession. 

At the time, it was pretty disappointing, but I'm happy to give credit where it's due: -  Ecoinnovation were superb in their support both of me and their product, and readily honoured their warranty. They came up with a specially re-worked board encased in epoxy which has stood the test of time and is still the one in the turbine now.

Reading this week of a fellow Powerspout GE400 owner whose board failed in January this year, and for whom Ecoinnovation also readily provided a replacement under warranty despite it being 3 years after his original purchase, I thought the matter worth writing about.  The issue is likely to be something which, sooner or later, will affect anyone with a GE400 turbine.


An original circuit board in situ. The three phase rectifier block on the left acts only to protect the circuit board against possible back flow of power from the inverter.  It is not the main means of ac rectification.

To recap on what this circuit board does and why it is needed: 
  1. it changes the ac output of the SmartDrive alternator to a dc output for the inverter
  2. it ensures the resultant dc output does not exceed 400 volts by two means, the second being failsafe for the first:
    • diverting power to a water cooled heating element when voltage reaches 380 v
    • shorting the output if voltage reaches 400v
  3. capping of the dc voltage output is necessary because an inverter will be irrepairably damaged by voltages greater than its rated input voltage (400 v for the obsolete Sunny Boy 1200 but now 500 or 600 v for current Enasolar inverters)
  4. voltage WILL rise to very high levels when the turbine is unloaded and the electrical output is in open circuit because:
    • the pelton will accelerate to runaway speed (which is ± 1.8 x optimum speed)
    • the voltage output of a pma is speed dependent so as the pelton over-speeds, so over-voltage will result
    • it is a characteristic of pma's that they exhibit poor voltage regulation and voltage rises when there is no circuit connected to the output.
  5. such open circuit / unloaded operation of the turbine / generator is an inevitable occurrence which will happen every time the set is run up (because of the time it takes for the inverter to wake up and check the grid for compatibility before connecting) and every time the inverter disconnects from the grid for whatever reason.

So the need for voltage capping is unavoidable and the V-Clamp board pictured above and devised by Andrew Smithies was a really neat, failsafe and compact solution which tidily sat within the Powerspout casing.  


Unfortunately, that location within the casing was also its Achilles heel.  In spite of the slight warmth created by the alternator, in spite of the ventilation provided by the fins on the rotor, and in spite of giving the board a generous conformal coating of silicone, water penetration to the board led to failures:


Tell-tale ooze of melted silicone with underlying blackening gives away where the problem was on the reverse side of this board


With the silicone removed, there is clear evidence of arcing across the pcb surface between the terminals of this power MOSFET on this board


With circuit board removed leaving behind the white heat transfer paste showing where it was attached, the evidence for water trickling down from the board is clear.  

With several dampness related failures of the board, Ecoinnovation was forced to withdraw from its range the GE400 and other turbines using a similar board.  But with developments in inverter technology which saw inverters able to accept up to 600 v, together with using Smart Drive cores configured to deliver a lower operational voltage and thus lower open circuit voltage, things came together to keep the grid connected Powerspout as a viable option.

The need to cap voltage was not completely eliminated however and instead of the neat arrangement of having the board within the casing, this is now provided by a range of products which need to be housed separately. One of these products comes from a UK company called 2V Microsystems Ltd under their trade name Klampit and another is a product from Chinese company Ginlong.

Sooner rather than later, obtaining a replacement original V-Clamp board is going to be impossible.  When that time comes, moving over to a Klampit will probably be my best option but that will involve, for me, having to figure out where to house the extra components.  Being out in the open, I don't have the wall of a turbine house to mount these extras.

In the mean time, I am hoping that my epoxy encased 'special' will go on working for a while yet.  And in case it doesn't, I have carefully kept my two failed boards as they are repairable if not too badly damaged.  The secret is in knowing how to remove the generous coating of silicone: put the board in the freezer at -23 ℃ for a while and then it mostly breaks away leaving the components on the board pristine.  But be warned, lots of patience and several returns to the freezer will be needed.


My 'special' epoxied board, repair of which will never be possible.  Note also condensation on bulkhead.

Thursday, 27 August 2015

Cutting nozzles

There's a bit of an art to cutting Powerspout nozzles, at least if you're trying to get a precise diameter of orifice so it delivers a precise flow.  

I don't know how others do it but my technique is to mount a blank nozzle in the chuck of a wood lathe and serially slice off discs until the orifice diameter is exactly the size I want. Being hollow cones, the more you cut off, the bigger the orifice. I have the lathe turning as slowly as it will go and the knife needs to be as sharp as possible.  It's rather too easy to take off too much and end up with an orifice which is bigger than you intended.  


Measuring the resulting hole with real accuracy requires a "small hole gauge set".  Such a set provides a series of gauges which open up a 'split ball' until its diameter is just capable of passing through the orifice you have cut.  A micrometer is then used to measure the diameter of the split ball to the nearest 0.02mm.


The quality of the jet emerging from a nozzle is an important factor contributing to getting maximum efficiency from a runner, be it a pelton or a turgo runner.  The surface of the jet should be smooth and the jet should remain compact and not break up too quickly after emerging from the orifice.  To get such a jet, a good orifice is crucial and by cutting the nozzles in the way I do, a really clean edge is obtained which makes for the sort of jet you want.


The reason for cutting new nozzles, and bigger ones than I usually use, is because for the coming generating year 2015/16, I plan to use only the bottom jet.  There is greater efficiency to be had if you can deliver the flow through one nozzle rather than two and if that nozzle is the bottom one.  This is because the energy loss associated with nozzles is confined to just the one nozzle and being in the bottom position, splash and spray fall downward away from the runner, preventing rotational energy being sapped by the drag of the pelton rotating through water laden air.

EcoInnovation have in the past stipulated that power should not exceed 400W with single jet operation but Michael Lawley has indicated this is not a hard and fast rule. For my set up, I should be OK on one jet all the way up to design power of 750W (which is at 3 lps, and this should be provided by a nozzle orifice of 11.5 mm if my calculations are right !).  

So that's why I've been cutting new and bigger nozzles: - to meet this plan for generation in the coming year.  There's nothing like having a plan !