6.48 mm diameter nozzle delivering 0.91 l/s to the runner which is rotating at 1084 rpm and generating 225 watts into the grid at an overall efficiency of 47%.

Thursday, 23 April 2020

Changing a nozzle - in 28 seconds !


Covid 19 lockdown is making me experiment with new ways (for me) of using digital media.
Here, filmed in time lapse, is the bottom nozzle being changed for a smaller one because water supply is drying up.
The smaller nozzle also required two spacer washers to be added under the Smart Drive rotor - but filming of that didn't work out; maybe I'll try again and add it later .
Enjoy !

...next day:
it turned out that two washers generated fewer watts than one washer so today I removed one; here is the video in real time:


you'll see that: 

  • the rpm before removing the washer, when the turbine was connected to the grid, was 1152
  • the rpm after removal was 1218, but this was before the inverter had established connection to the grid
  • when the inverter established grid connection, rpm came down to 1058


The effect of this exercise is seen in the record below of output to grid: power output rose from 443 W to 468 W.
And this means that overall efficiency is better at 1058 rpm and one washer (53.6%) than at 1152 rpm and two washers (50.9%).
 A nice demo of how fine tuning can gain a few watts.


Thursday, 2 April 2020

More graphs.

All things, both good and bad, come to an end.  This week, as the world still battles the flu pandemic, my Powerspout has ended its unprecedented good run of generating at full power: 156 days continuously at between 900 and 928 watts. That's 3.4 mega watt hours of energy, - more than it usually generates in a whole year.

The reason for this bonanza was the exceptional winter rainfall, which as well as bringing generating power also brought us floods. Starting early in October and peaking in February, the rainfall on the hillside where I live comfortably exceeded the long term average until March, as the graph below shows.


I have written before about wanting to understand the relationship between the amount of rain and the amount of energy the turbine can generate. The matter was what prompted me to start measuring rainfall 3 years ago. The relationship ought to have a quantitative element: more rain leads to more energy, - and ought also to have a temporal element: a relationship in time between rain falling or not falling and generation changing.

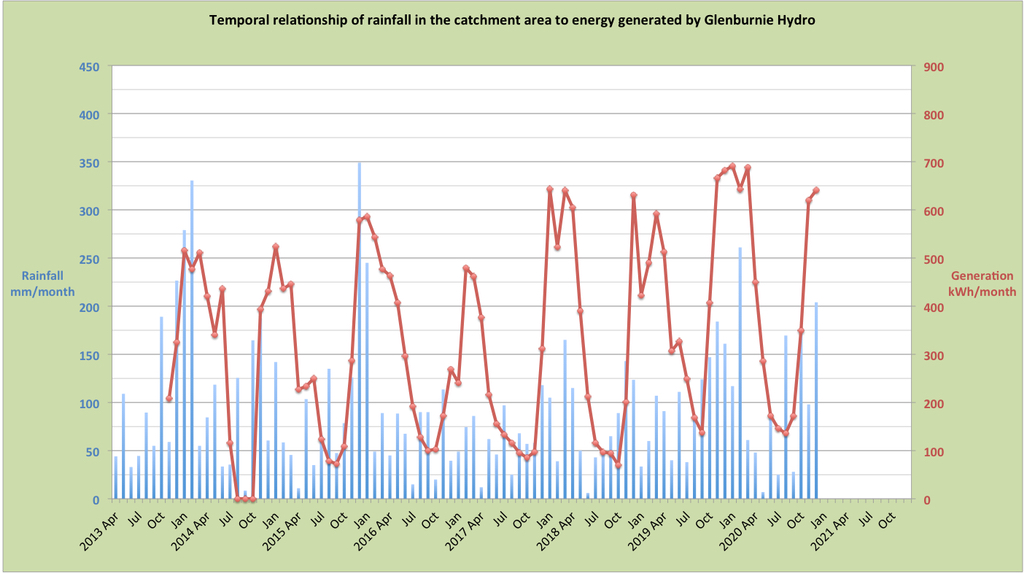
now have enough rain and energy data to show these relationships in a graph: (note added 10 Jan 2021: the graph has been updated with additional data)


What it seems to show is the quantitative relationship is confirmed: more rain leads to more energy; but with the proviso that since turbine output is limited to 600 - 700 kWh/month, if there is rain in excess of what will generate that number of kWh's, the relationship no longer holds true; rainfall of 125 mm per month seems to be enough to generate maximally.

The temporal relationship is also evident: in autumn several months of rain needs to fall before turbine output picks up: generation can be said to lag behind rainfall; after a dry summer (e.g. June 2018) this can especially be seen and is doubtless due to ground water being much depleted and needing topping up before the spring, on which my turbine depends, begins to have a good flow.

There is a corresponding mismatch at the start of each year but here generation exceeds what might be expected from rainfall, i.e. turbine output persist for longer than expected; this is understandable as being because the spring continues to flow strongly from ground water accumulated over preceding winter months. Such 'bonus' generation tends to get terminated rather abruptly in April when trees start coming into leaf, so making their own demands on groundwater for transpiration.

Graphs are a useful way of understanding data and we are all being given an education in the use of graphs by the present flu pandemic. When I write again, life will probably be returning to normal from the point of view of flu, though it will be later than that when turbine output returns to the good levels of the past 156 days.

Monday, 9 December 2019

Asset Earning Potential

A big business thinking of building a new manufacturing plant or purchasing a new bit of equipment, will want to know what the earning potential for the new venture is. In no less a way, someone putting in a small hydro will want to know what the earning potential is and whether it makes financial sense to install it.

In big business, working out 'asset earning potential' is relatively easy because costs and benefits can be estimated.  But for hydro it's not so straight forward; there is the imponderable of Mother Nature: - years will be wet or dry, some very wet and some very dry.

Is it possible to bring systematic thinking to 'asset earning potential' under such circumstances ?

Some years back I heard a talk about the subject. It was given by Kieron Hanson who is a director of Hydroplan, an engineering and consultancy company installing hydros throughout the UK.  In his talk he put up this slide, headed AAEP, which stands for Annual Asset Earning Potential:


  • What it depicts (insofar as I remember his talk) is this:
  • for a hydro, there is a central value for AAEP which will be the average income, calculated over several years, that the hydro brings in
  • to factor in the normal variation in rainfall this AAEP will have an "upside" error band and a "downside" error band indicating the extent to which income will be affected by wet and dry years
  • the upside wetter years can be 12% above AAEP whilst the downside drier years 34% below 
  • exceptionally, years may be very wet or very dry leading to a greater variation from the AAEP central estimate than is seen in usual years
  • these exceptional years can increase income if the year is wet by 21 to 34 % above central AAEP but decrease it if the year is dry by 26 to 34 %. (where he quotes percentages, I'm not sure how they were arrived at).


So much for the theory.  Does it seem to apply in practice  ?

For my small hydro, rather than taking earning potential in money, I've looked at it simply as kWh's of energy generated; doing so avoids needing to 'monetise' the energy generated and therefore avoids thinking about feed-in tariff, and avoids also the monetary value of the saving being made by not importing grid energy, which is tricky to calculate.

For my scheme, the central AAEP in kWh's over the past 6 years has been 3575; the highest figure for generation has been 4083 and this gives an upside error band of 14%; the lowest generation figure has been 2773, giving a downside error band of 22%.  So my generation figures tie in quite nicely with what Mr Hanson's slide showed, - broadly similar upside and downside error bands compared to his predictions.

So far no year for which I have a full data set has been exceptionally wet or exceptionally dry. But the current year just started (my years run Oct 1st to Sep 30th) is looking very much as if it might be an exceptional year; the start is proving to be very wet. Here is the graph of cumulative kWh's generated, with the current year shown by the black line; I am updating it each month after having written this post:


It can be seen that the trajectory of the line is hugely different from any previous year. If it proves to follow the rule of the slide and be 34% over AAEP, the total for the whole year should come in at 4790 kWh. (note added 1st Oct 2020: as the graph shows, the total came in at 5133 kWh, 44% over AAEP).

Does any of this help with deciding if a hydro is worthwhile ? - not really ! But it should make one cautious about proceeding with a scheme on the basis of a single year such as this present one; such a year would give a false impression of how productive a scheme might be and make a borderline scheme have the appearance of being worthwhile when in truth for most years it may not be.